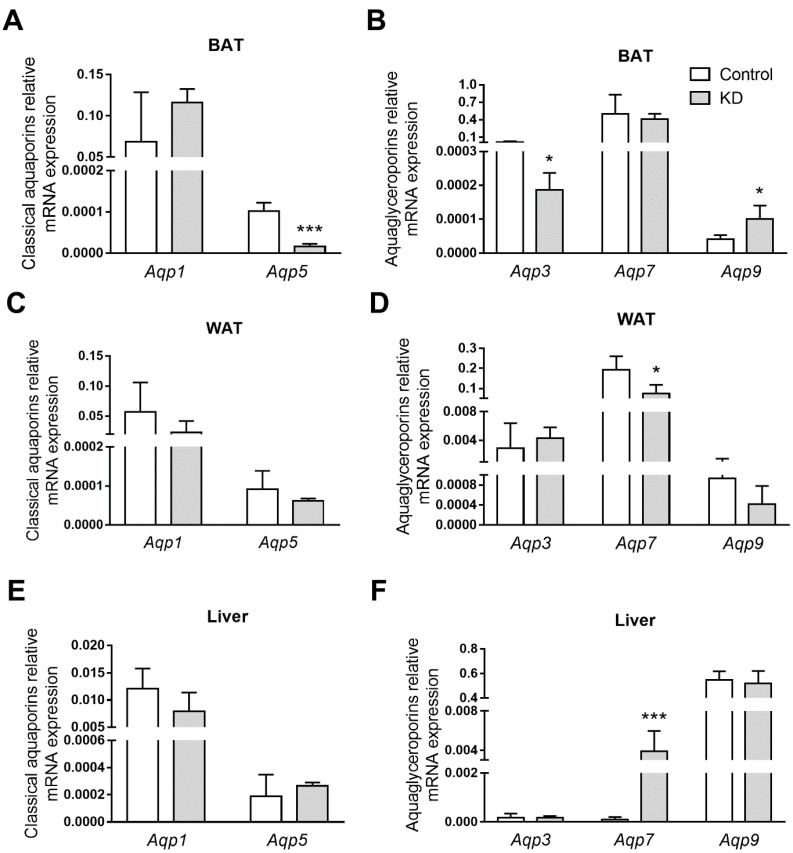
Figure 5.
Aquaporin gene expression in (A,B) white adipose tissue (WAT), (C,D) brown adipose tissue (BAT), and (E,F) the livers of ApoE−/− mice fed control or a ketogenic diet (KD). Relative gene expression of (A,C,E) classical aquaporins and (B,D,F) aquaglyceroporins. Data shown are the mean ± SEM (n = 6–8/group). *, p < 0.05; ***, p < 0.001, KD versus control.

