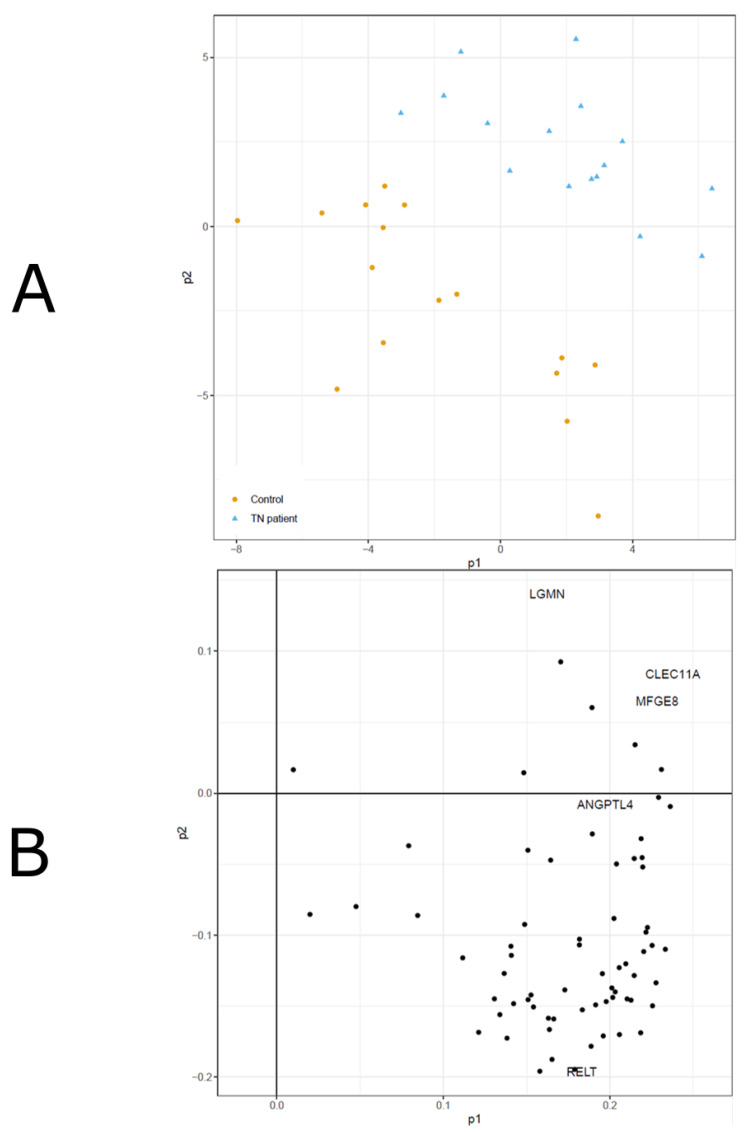
Figure 2.
(A,B). CSF biomarkers in TN patients and controls—a PLS-DA analysis. A PLS-DA model (2A) and the corresponding loadings (2B) of CSF biomarkers in TN patients and controls are demonstrated. The model was trained to separate between TN and controls. The model showed good performance (mean error rate = 0.058) in separating between the two groups as evaluated in the cross-validation procedure. In the loadings plot, all proteins with VIP > 1.3 are named, and the remaining proteins are only shown as dots.

