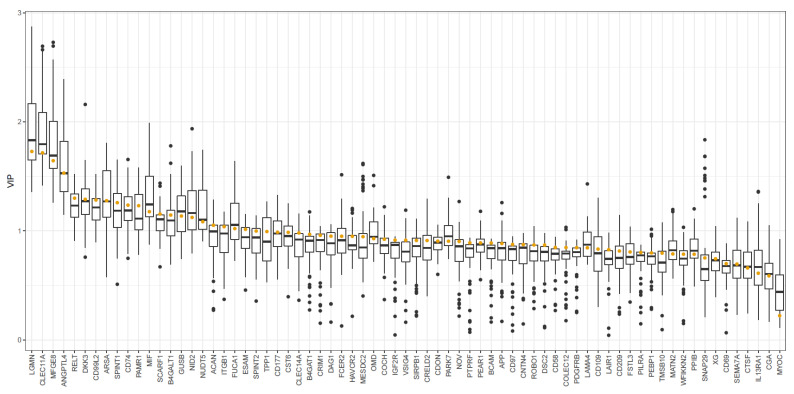
Figure 3.
CSF biomarkers in TN patients and controls—a PLS-DA VIP analysis. The figure demonstrates the VIP values for clinical and biomarker variables in the PLS-DA model predicting patient or control CSF samples based on PEA data. The yellow dots represent the VIP for the full model (based on all data). The boxplots represent the VIP for the cross-validated models.

