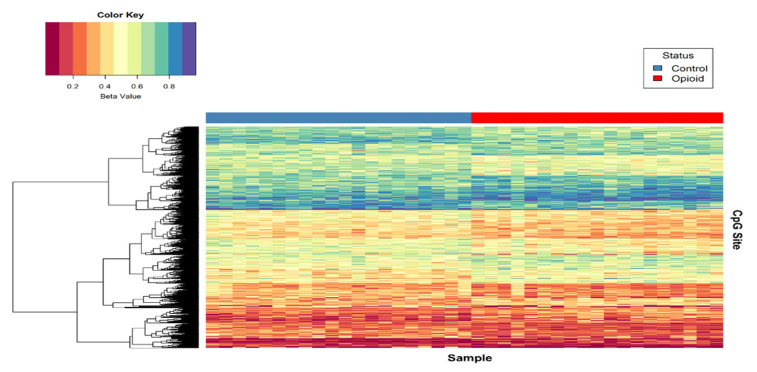
Figure 3.
Heat map of normalized beta values for the top differentially methylated CpG sites associated with opioid treatment. Beta values for CpG sites with an unadjusted p < 0.005 and |∆β| ≥ 0.05 are shown (n = 684). Each row contains the beta value for a CpG site, color-coded from 0-1 (see color key, top left), and columns pertain to individual samples (n = 39). Samples were grouped by opioid-exposure status (top blue bar, left = controls; top red bar, right = opioid-exposed). Hierarchical sorting was performed by CpG site (row), and the dendrogram (left) indicates similarities in methylation trends across all CpG sites.

