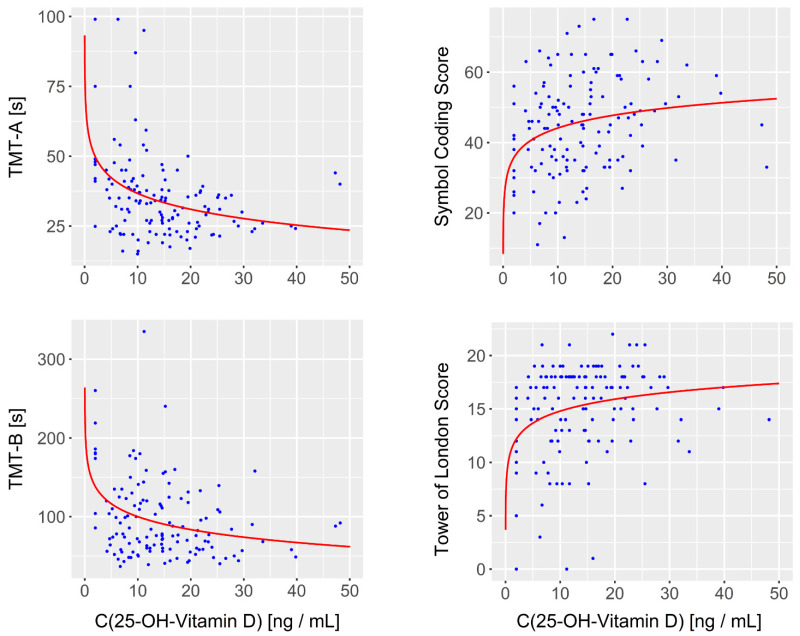
Figure 2.
The relationship between 25-OH vitamin D-levels and cognition. Scatter plots and estimated regression curves are shown for the four cognitive items for which vitamin D’s impact remained statistically significant after Bonferroni correction of multiple comparisons. Curve fitting indicated that each of the different cognitive items (y-axis) could be best described as a function of the logarithm of the 25-OH-vitamin D-concentration (x-axis).

