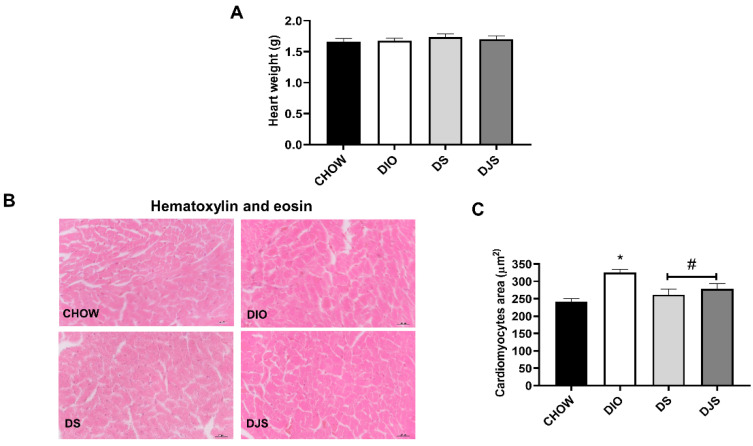
Figure 1.
Heart weight and assessment of cardiomyocyte hypertrophy. (A) Whole heart weight; (B,C) Representative pictures of hematoxylin and eosin staining and quantification of cardiomyocyte cross-sectional area CHOW rats (n = 8), fed with standard diet; DIO rats (n = 9), fed with high-fat diet; DS (n = 12), DIO rats supplemented with tart cherry seeds; DJS (n = 9), DS rats supplemented with tart cherry juice. Magnification 40×. Scale bar 25 µm. Data are mean ± SEM. * p < 0.05 vs. CHOW rats; # p < 0.05 vs. DIO rats.

