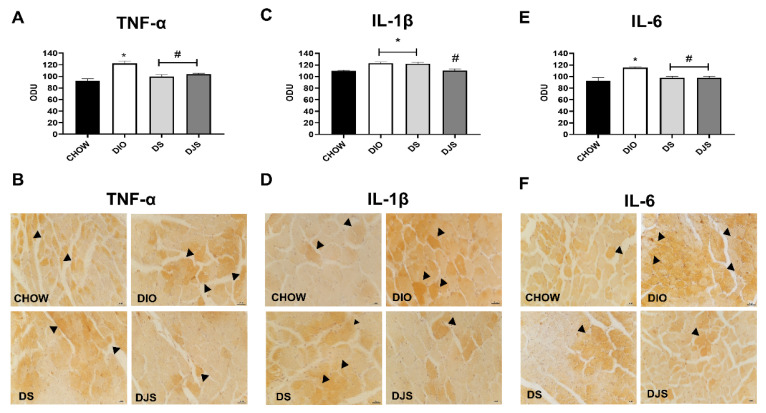
Figure 8.
Immunohistochemical analysis of inflammatory cytokines. Graphs indicate the mean intensities of area immunoreaction of tumor necrosis factor-α (TNF-α) (A), anti-interleukin-1β (IL-1β) (C), and interleukin-6 (IL-6) (E) measured in the arbitrary optical density unit (ODU). Data are mean ± SEM. * p < 0.05 vs. CHOW rats; # p < 0.05 vs. DIO rats. Immunohistochemical representative pictures of heart sections processed for TNF-α (B), IL-1β (D), and IL-6 (F). The immunoreactive cardiomyocytes are indicated with arrowheads. Magnification 40×. Scale bar 25 µm. CHOW rats (n = 8), fed with standard diet; DIO rats (n = 9), fed with high-fat diet; DS (n = 12), DIO rats supplemented with tart cherry seeds; DJS (n = 9), DS rats supplemented with tart cherry juice.

