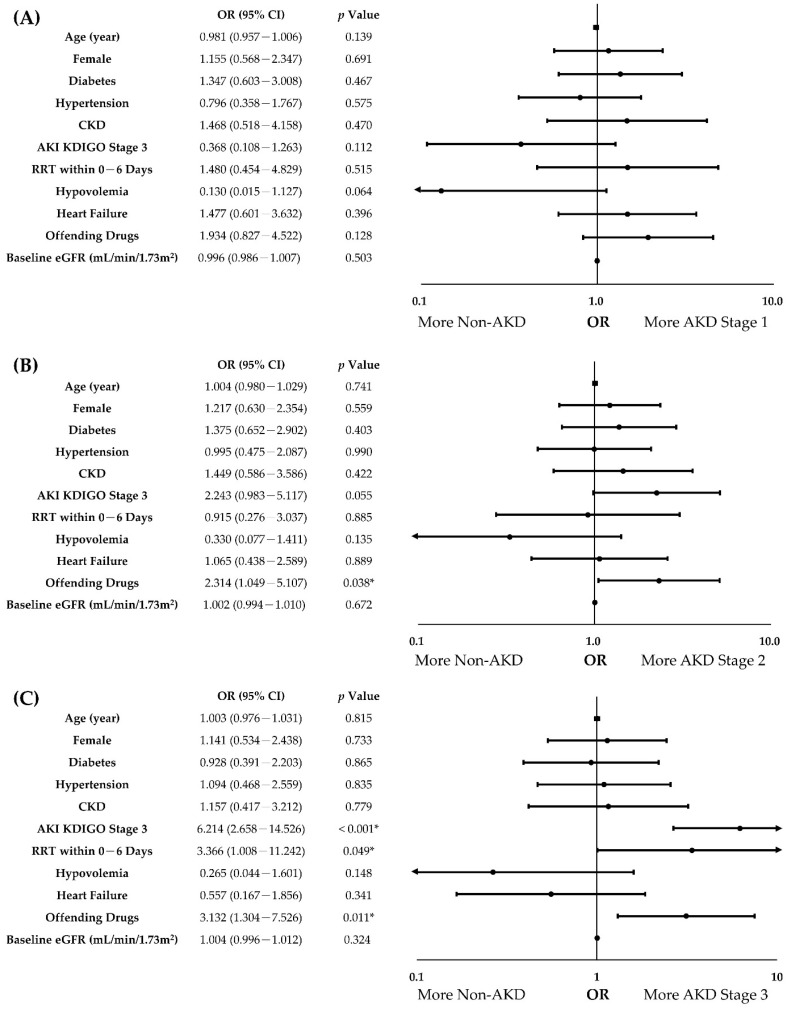
Figure 2.
Forest plots of independent predictors of AKD severity in patients with AKI. (A). AKD Stage 1 vs. non-AKD; (B). AKD Stage 2 vs. non-AKD; (C). AKD Stage 3 vs. non-AKD. Age, sex, diabetes, hypertension, and covariates with a p-value of <0.10 in univariate analyses were adjusted for multinomial logistic regression analysis with the enter method. CI, confidence interval; CKD, chronic kidney disease; eGFR, estimated glomerular filtration rate; OR, odds ratio. *: p < 0.05.

