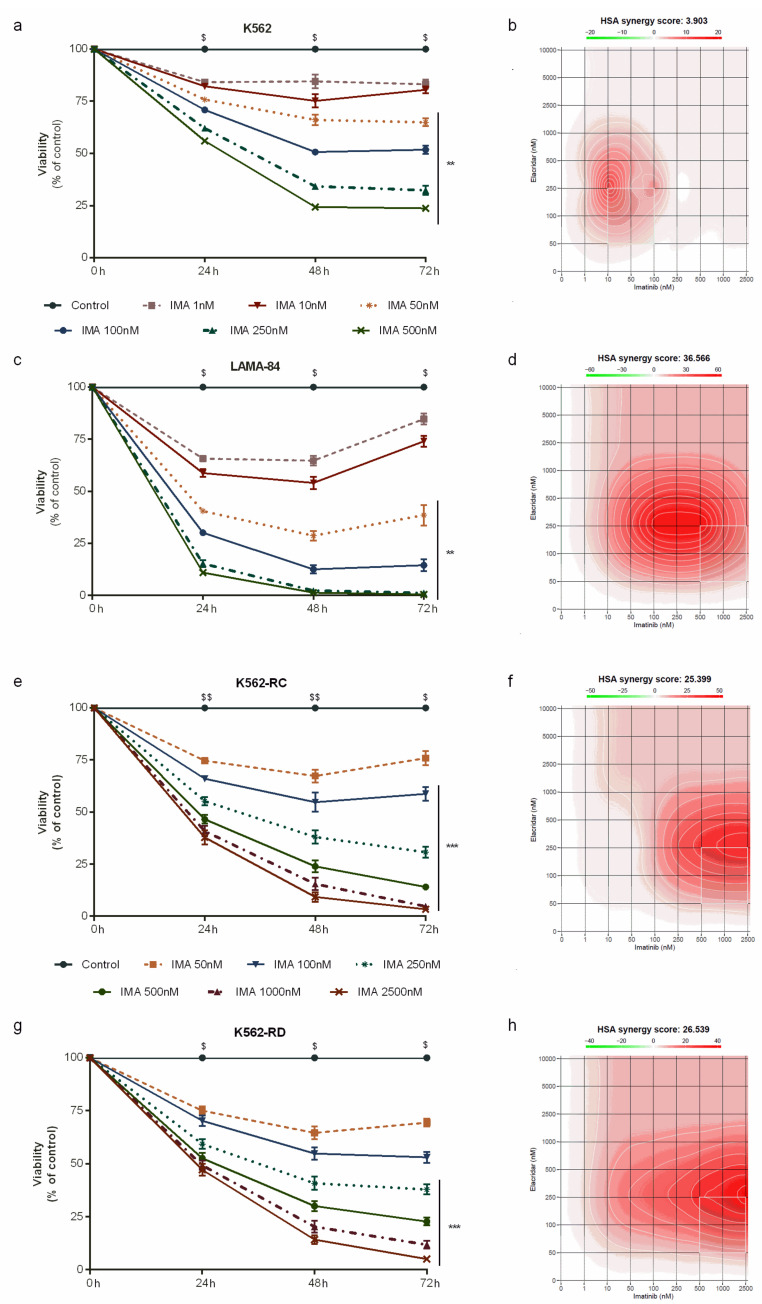
Figure 3.
Dose–response curves of imatinib plus elacridar on sensitive and imatinib-resistant CML cell lines. K562 (a), LAMA-84 (c), K562-RC (e), and K562-RD (g) cells were incubated in the absence and presence of different concentrations of imatinib in combination with elacridar 0.25 μM during 72 h. The control cells correspond to cells treated with 0.25 μM of elacridar. Results were expressed as a percentage (%) normalized to control and represent the mean ± SEM obtained from nine independent experiments. The HSA synergy scores for imatinib plus elacridar were calculated using SynergyFinder 2.0 for K562 (b), LAMA-84 (d), K562-RC (f), and K562-RD (h) cells. A HAS synergy score value >10 was considered synergistic, between −10 and +10 was considered additive, and a synergy score <−10 was considered antagonistic. ** p < 0.01; *** p < 0.001 (comparison with control); $ p < 0.05, $$ p < 0.01 (comparison with 0 h). Ima: imatinib.

