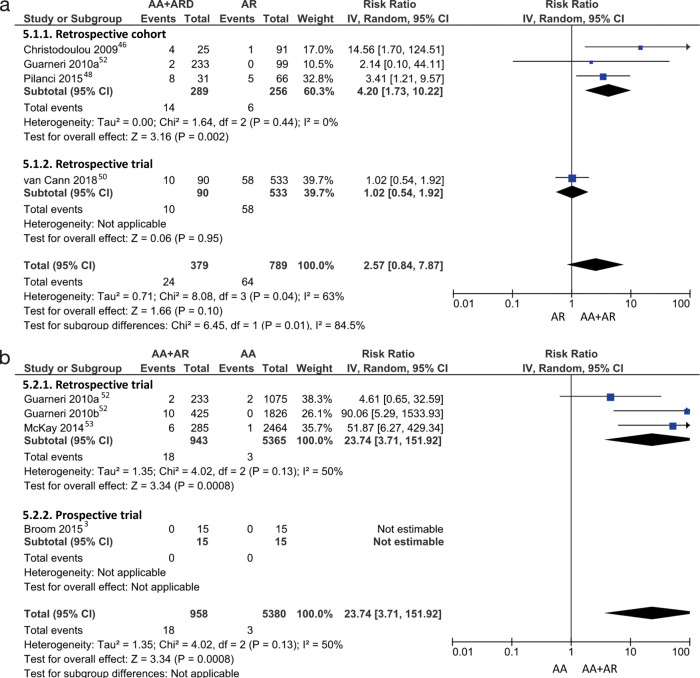
Figure 5.
Forrest plot for meta-analysis of risk ratio of medication-related osteonecrosis of the jaw in patients administered concurrent antiresorptive and anti-angiogenic drugs versus (a) antiresorptive drugs only and (b) antiangiogenic drugs only. Blue square: risk ratio estimate of individual study; horizontal black line: 95% CI of individual study result; diamond: pooled risk ratio estimate; vertical black line: line of null effect.

