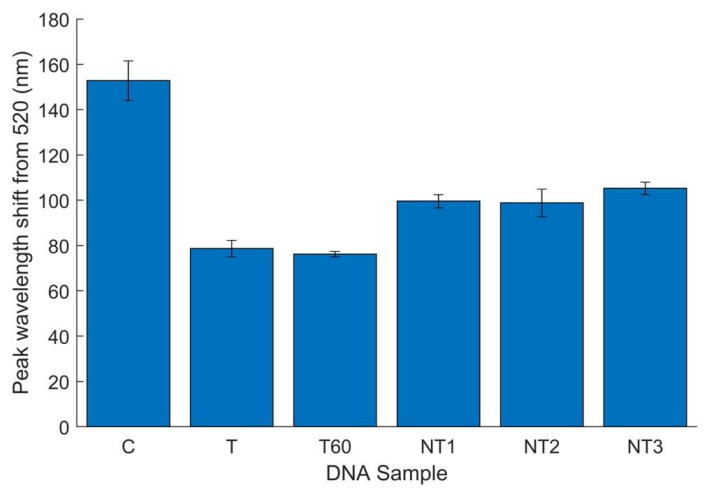
Figure 8.
E. coli O157 specificity results in flour, analyzed by peak wavelength shift from 520 nm. Six replicates total with DNA concentrations of 60 ± 5 ng/µL unless otherwise noted. Error bars represent 95% confidence intervals. C, water; T, E. coli O157 at 83.4 ng/µL; T60, E. coli O157 at 60 ng/µL; NT1, E. coli C-3000; NT2, Listeria monocytogenes; NT3, flour without artificial inoculation.

