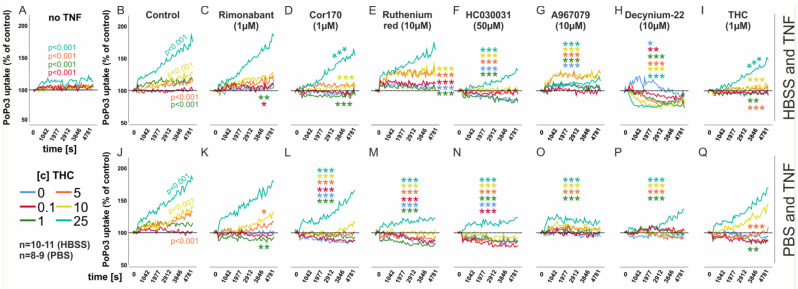
Figure 3.
Mean PoPo3 uptake by RASF in response to THC. (A) PoPo3 uptake without TNF pre–stimulation, (B,C) by THC with TNF (10 ng/mL) pre–stimulation for 72 h and extracellular calcium (HBSS; (B–I)) or without calcium (PBS; (J–Q)). *** p < 0.001, ** p < 0.01, * p < 0.05 for differences between antagonist treatment and control (THC only, Figure 2B,J). (B,J) Comparisons of different THC concentrations versus control (no THC). Significant values are given in the graph. ANOVA with Bonferroni post hoc test was used for all comparisons. Rimonanbant, CB1 inverse agonist; COR170, CB2 inverse agonist; A967079, TRPA1 antagonist; HC-030031, TRPA1 antagonist; RR = Ruthenium Red, general TRP inhibitor, Decynium-22, organic cation transport inhibitor.

