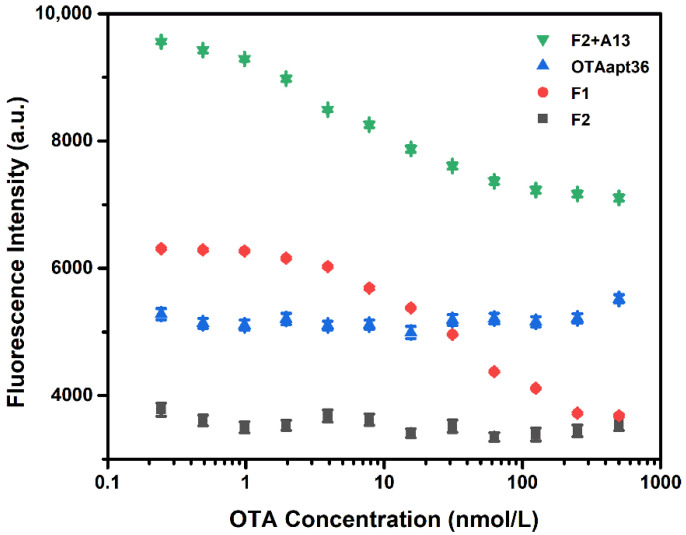
Figure 1.
Comparison of the fluorescence intensity of the F1-based aptasensor and F2-based aptasensor with different OTA concentrations (n = 3). The concentration of the F1, F2, and OTAapt36 aptamers was 20 nmol/L, and the concentration of A13 was 60 nmol/L. The error bars denote the standard deviation of the triplicate measurements.

