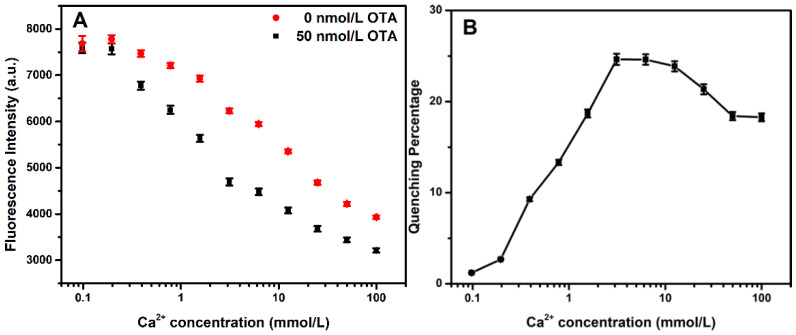
Figure 2.
(A) Fluorescence intensity of the F1 aptasensor with different concentrations of Ca2+ (0–100 mmol/L) in the presence and absence of 50 nmol/L OTA (n = 3). (B) Quenching percentage with different concentrations of Ca2+ (0–100 mmol/L). The error bars denote the standard deviations of the triplicate measurements.

