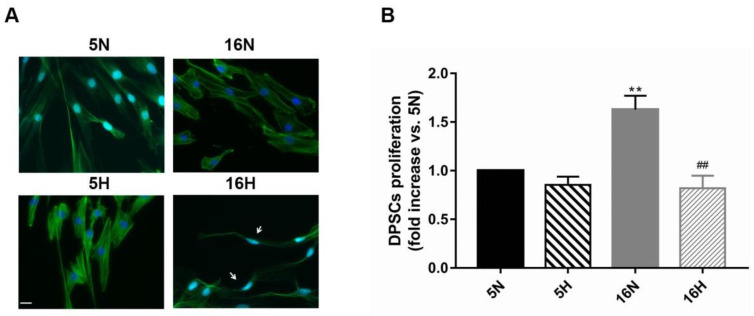
Figure 1.
Effects of hypoxia on DPSC morphology and proliferation. (A) Representative images of phalloidin-stained DPSCs exposed or not to hypoxia for 5 and 16 days, as described in the Materials and Methods section (Table 1). White arrows indicate cell morphology changes. Scale bar 20 µm. (B) Histograms show that hypoxia induced a significant decrease in proliferation rate exclusively after 16 days of exposure in comparison to normoxia. Histograms indicate the means ± SE of three different cultures, each of which was tested in triplicate. Statistical analysis was performed by one-way ANOVA followed by Tukey’s test. ∗∗ p < 0.01 vs. 5N, and ## p < 0.01 vs. 16N.

