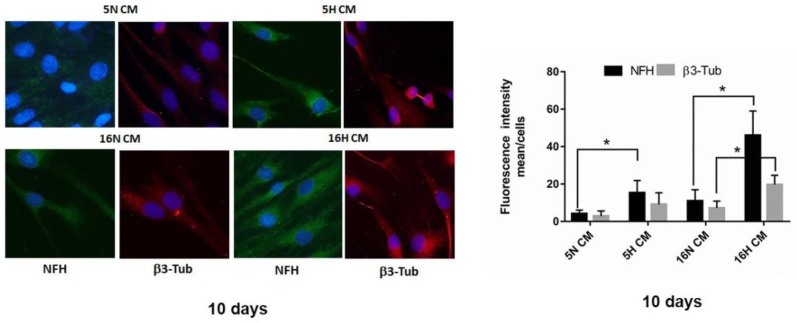
Figure 5.
Immunofluorescence analysis of DPSCs. (left). Immunofluorescence analysis of NFH and β3-Tubulin in DPSCs treated with DPSC-CM (5H CM, 16H CM) or DPSC-CM (5N CM, 16N CM) groups. Scale bar 20 µm. (right). Analysis of fluorescence intensity NFH and β3-Tubulin in DPSCs treated with DPSC-CM (5H CM, 16H CM) or DPSC-CM (5N CM, 16N CM) groups. Data are represented as mean ± SE. Statistical analysis was performed by Student’s t-test; * p < 0.05; 5H and 16H vs. 5N and 16N.

