Figure 1.
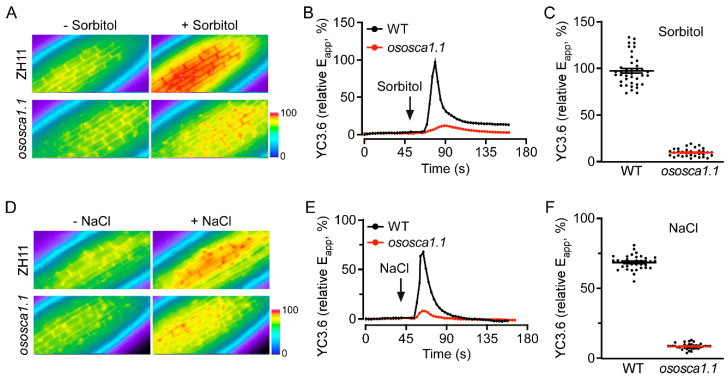
OsOSCA1.1 mediates hyperosmolality-induced [Ca2+]cyt (OICIcyt) and salt-induced [Ca2+]cyt (SICIcyt) increases in rice seedling roots. (A–C) OICIcyt was monitored in the root cells of ZH11 and ososca1.1, expressing Yellow Cameleon YC3.6 (YC3.6) under treatment with 250 mM of sorbitol. Eapp, relative apparent Förster resonance energy transfer (FRET) efficiency of YC3.6. (A) Typical image before and after treatment, (B) changes in [Ca2+]cyt over time, and (C) mean change in [Ca2+]cyt in response to 250 mM of sorbitol in ZH11 and ososca1.1 [means ± standard deviation (SD); n = 40]. In (B), black and red lines indicate [Ca2+]cyt in ZH11 and ososca1.1, respectively; black arrow indicates hyperosmolality stress initiation. In (C), black dots indicate individual experiments; black and red lines indicate mean changes. (D–F) SICIcyt was analyzed in the root cells of ZH11 and ososca1.1 expressing YC3.6 under treatment with 100 mM of NaCl. (D) Typical image before and after treatment, (E) changes in [Ca2+]cyt over time, and (F) mean change in [Ca2+]cyt in response to 100 mM NaCl in ZH11 and ososca1.1 (means ± SD; n = 40). In (E), black and red lines indicate [Ca2+]cyt in ZH11 and ososca1.1, respectively; black arrow indicates salt stress initiation. In (F), black dots indicate individual experiments; black and red lines indicate mean changes.

