Figure 5.
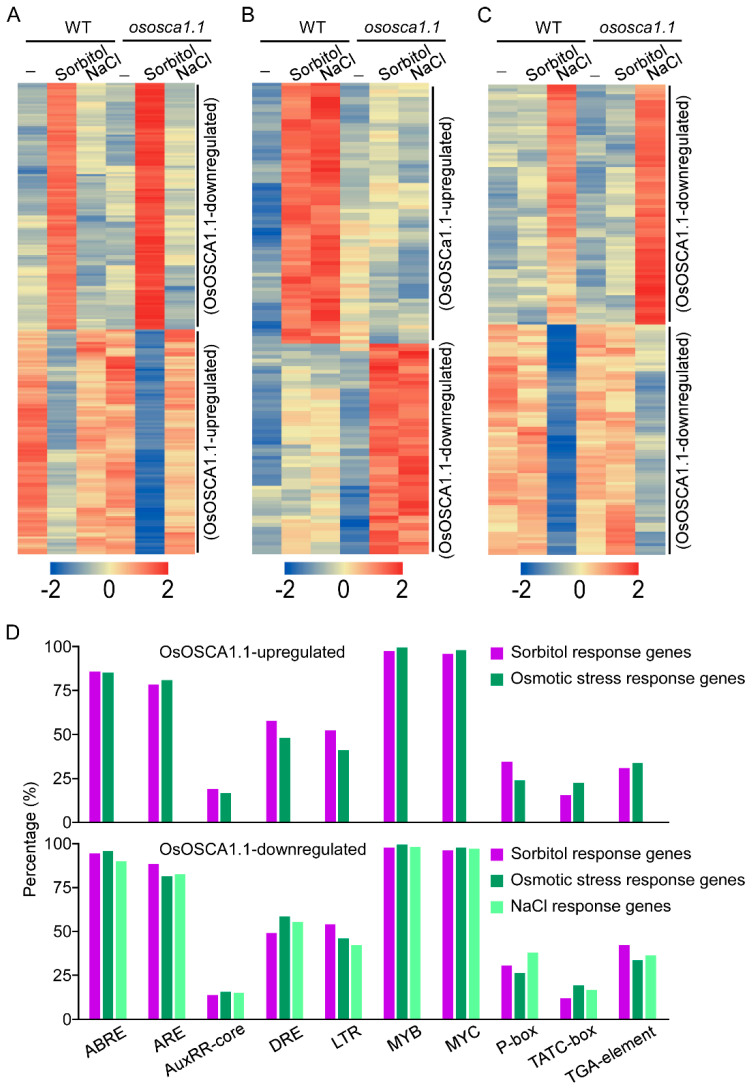
Enriched cis-regulatory elements in the 2000-bp promoter regions of three clustered OsOSCA1.1-regulated genes. (A–C) Hierarchical cluster analysis of the OsOSCA1.1-regulated genes in ZH11 and ososca1.1 plants associated with (A) sorbitol, (B) osmotic stress, and (C) NaCl according to Cluster 3.0 software. In each cluster, one row represents one gene; log (FPKM) values of each gene were calculated, and expression patterns are color-coded; red and green indicate high and low expression, respectively. FPKM values for each gene in every cluster are listed in Table S4. The gene expression pattern in each cluster was labeled on the right. (D) Different cis-regulatory elements were distributed in the 2000-bp promoter region of 178 OsOSCA1.1-upregulated genes (108 sorbitol response and 70 osmotic stress response), and 336 OsOSCA1.1-downregulated genes (119 sorbitol response, 56 osmotic stress response, and 126 NaCl response). The cis-regulatory elements were predicted using the PlantCARE program. The percentage of every cis-regulatory element distributed in the three types of OsOSCA1.1-regulated genes were calculated.

