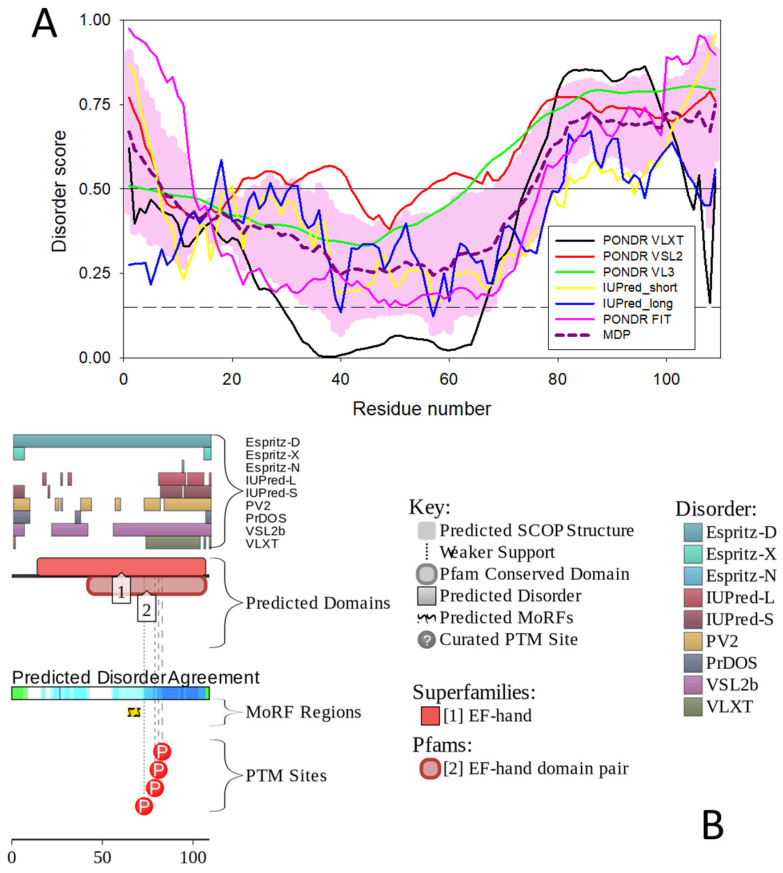
Figure 6.
Evaluating intrinsic disorder status of human oncomodulin. (A) Intrinsic disorder profile generated using outputs of PONDR® VLXT [128], PONDR® VLS2 [129], PONDR® VL3 [130], PONDR® FIT [131], IUPred2 (Short), and IUPred2 (Long) [132,133]. The outputs of the evaluation of the per-residue disorder propensity by these tools are represented as real numbers between 1 (ideal prediction of disorder) and 0 (ideal prediction of order). Mean disorder prediction (MDP) was calculated by averaging the outputs of individual predictors. Light pink shadow shows distribution of errors of mean. A threshold of ≥0.5 was used to identify disordered residues and regions in query proteins, whereas a threshold of ≥0.15 was implemented to identify flexible residues. (B) Functional disorder profile of human oncomodulin based on the D2P2 analysis [135]. Here, disorder propensity was evaluated based on the outputs of PONDR® VLXT [127], PONDR® VSL2 [129], IUPred [133,134], PV2 [136], PrDOS [137], and ESpritz [138] shown by nine colored bars representing the locations of disordered regions predicted by these tools. Agreement between these predictors is shown by the blue–green–white bar, where darker blue and green parts correspond to the stronger disorder consensus. Lines with colored and numbered bars show the positions of the predicted SCOP domains [139,140] using the SUPERFAMILY predictor [141]. Yellow zigzagged bar shows the location of the predicted disorder-based binding site (MoRF regions) identified by the ANCHOR algorithm [142]. Red circles represent location of phosphorylation sites based on the outputs of the PhosphoSitePlus platform [143].

