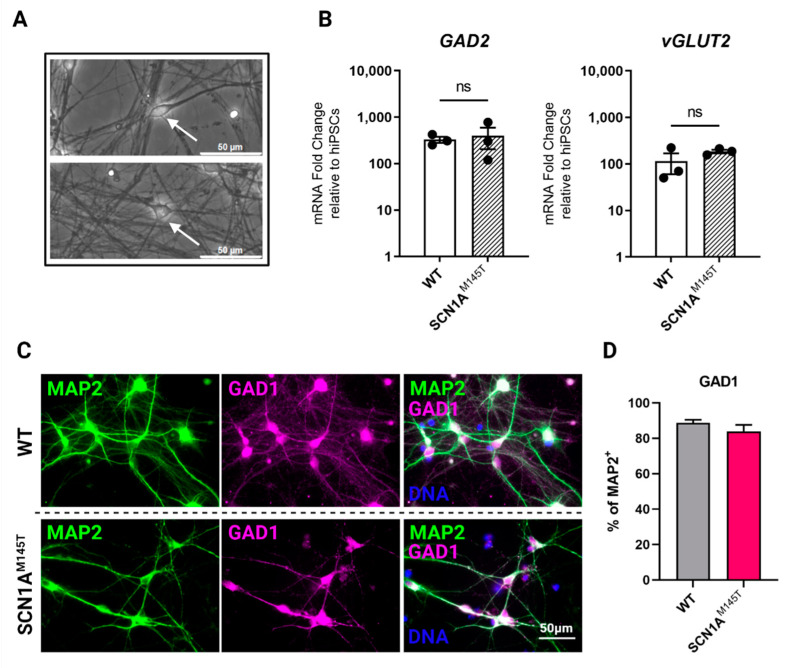
Figure 2.
Expression of GABAergic and glutamatergic markers in idNs. (A) Generated idNs are composed of a mixed neuronal population containing neurons with both bipolar (upper panel, white arrow) and pyramidal (lower panel, white arrow) morphology. (B) Expression analysis of mRNAs relative to GABAergic (inhibitory) marker glutamate decarboxylase 2 (GAD2) and glutamatergic (excitatory) marker vesicular glutamate transporter 2 (vGLUT2) in idNs relative to undifferentiated iPSCs. GAPDH was used as a housekeeping gene. qRT-PCR analysis did not reveal significant differences in the expression of GAD2 and vGLUT2 between diseased and control idNs relatively to their undifferentiated iPSCs (p-value = non-significant (ns), t-test), even though a higher prevalence of GABAergic marker GAD2 was detected, as shown by its higher fold change relative to iPSCs. Data are presented as mean ± SEM of three biological replicates (dots). (C) Representative immunofluorescence images of GABA synthesis enzyme GAD1 compared to neuronal marker MAP2 in idNs of WT (upper line images) and SCN1AM145T (lower line images) cells (63× magnification). (D) The diagram shows that about 90% of MAP2+ cells co-express the GAD1 marker. For each cell line, at least 300 neurons were counted, and data are presented as mean ± SEM of two independent experiments.

