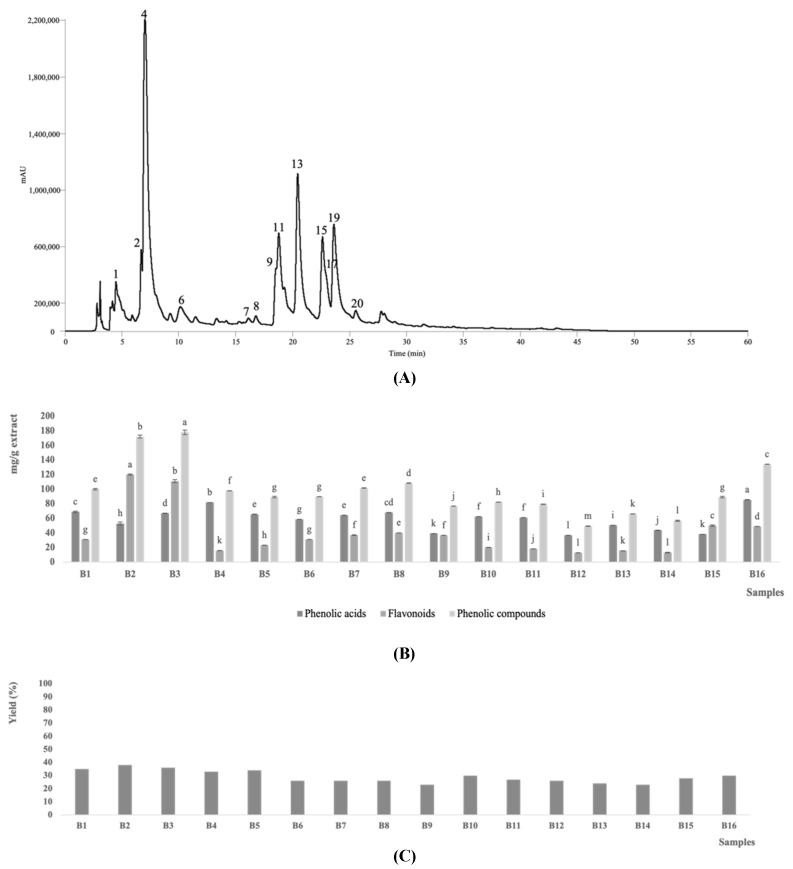
Figure 1.
Representative phenolic profile of the C. cardunculus blade extracts (B6 sample) recorded at 280 nm. The phenolic compounds tentatively identified are described in Table 1 (A); total contents (mg/g extract) of phenolic acids, flavonoids, and phenolic compounds in the extracts of the sixteen C. cardunculus samples. For each group of compounds, different letters correspond to significant differences (p < 0.05) between samples (B). Yield of the tested blades’ extracts (C).

