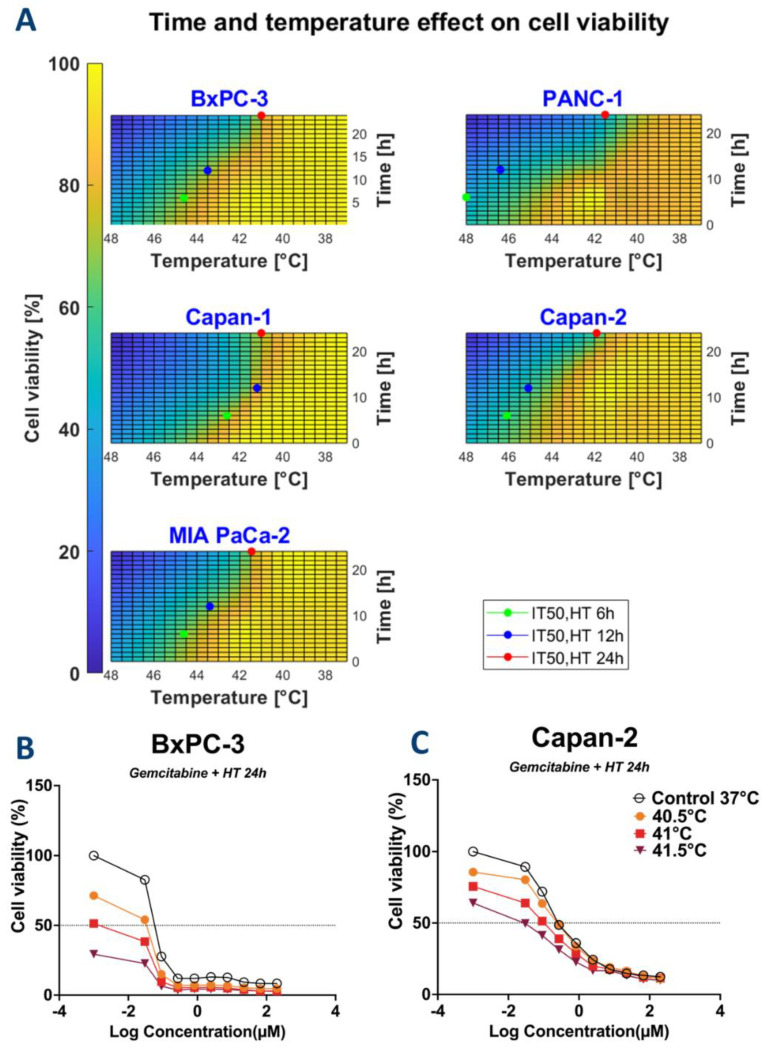
Figure 4.
Combination of time and temperature effects on cell proliferation as illustrated by heatmaps for the calculation of and for thermal therapy (A) Heatmaps showing the relative cell viability in function of time and temperature were used to calculate for thermal therapy. values are shown for each of the cell lines at 6-, 12-, and 24 h. Heatmaps show that treatment duration increases the cytotoxic effect of thermal therapy observed by a lower (i.e., lower temperatures are needed to decrease cell viability by half of its maximal effect). (B,C): Dose curve response of BxPC-3 and Capan-2 to gemcitabine for 24 h.

