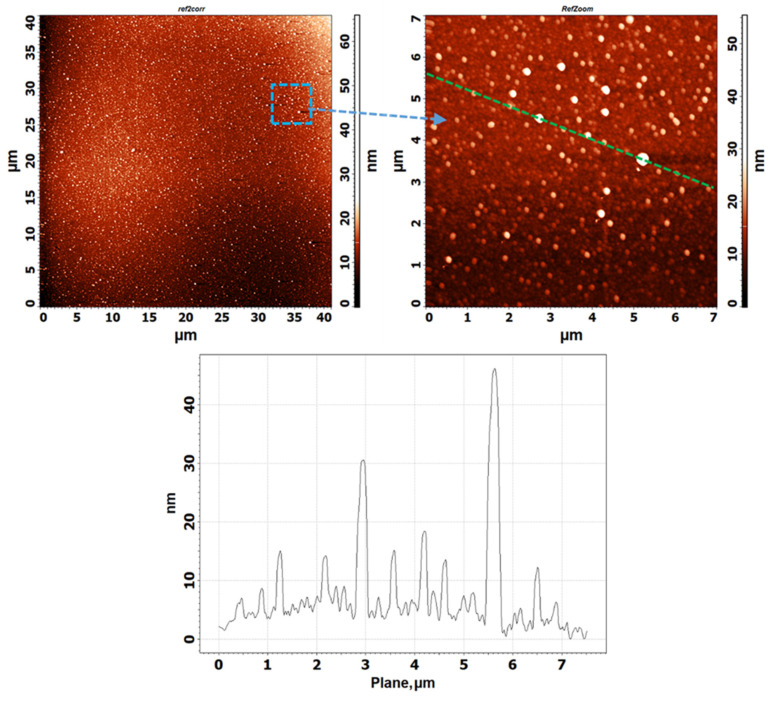
Figure 2.
AFM images of the metal surface of surface-enhanced Raman scattering (SERS)-active substrates without protein samples applied. The left panel shows a 40 × 40 μm area; the right panel shows the image obtained in the area marked with a blue square in the left panel (7 × 7 μm); the bottom panel shows the cross-section along the green line in the right panel.

