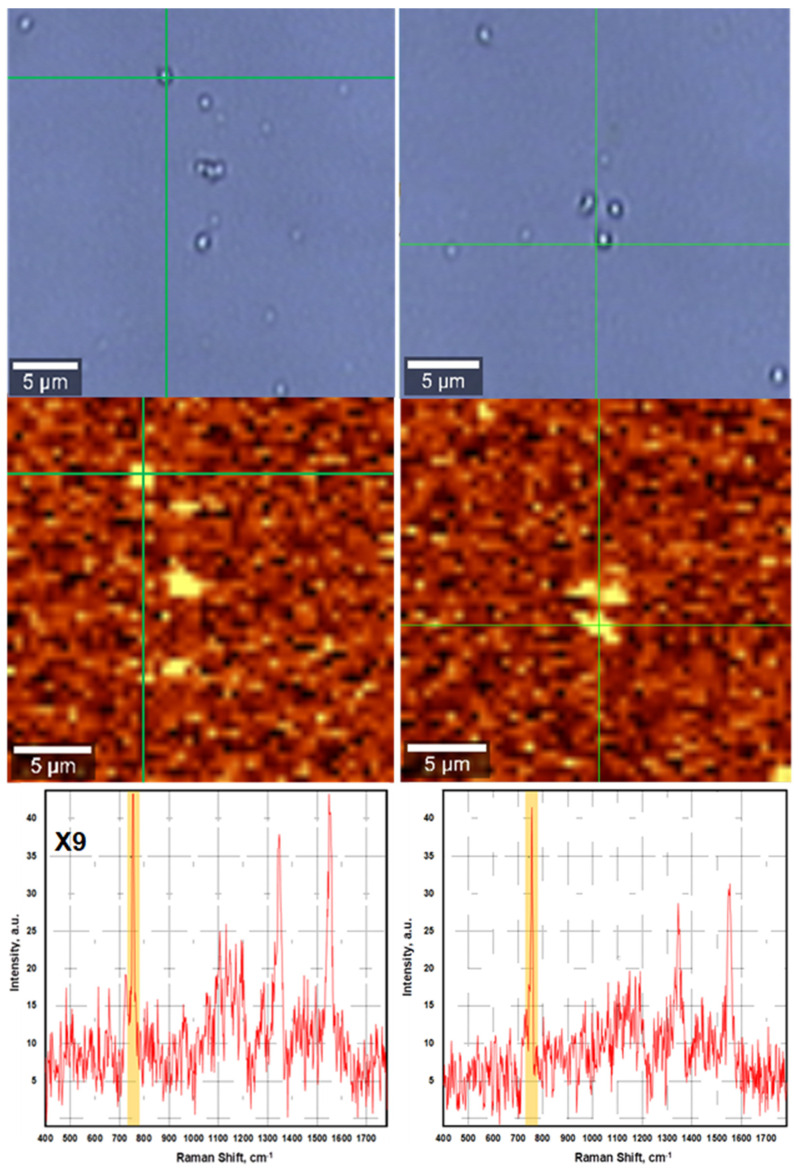
Figure 5.
SERS-mapping of a sample of the RBD protein with reduced disulfide bonds. Finding and SERS-mapping a sample of the RBD protein with reduced disulfide bonds applied onto the metal surface of the SERS-active substrate (the left column) and with an additional silver layer applied above (the right column). The upper panels show images in the wide-field upright optical microscopy mode. The middle panels show the confocal SERS-mapping in the characteristic band of the tryptophan line at about 755 cm−1 for subsequent recording of the SERS spectrum at the point indicated by the green cross (the lower panels). The scaling factor for the spectrum in the left lower panel is 9.

