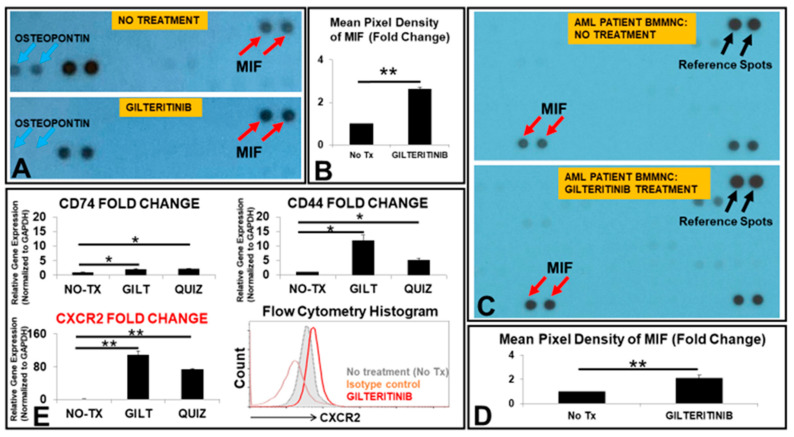
Figure 1.
MIF was released more by TKI-treated AML blasts in vitro and ex vivo. (A) Image of partial blot films developed for proteomic analyses of cell-free supernatants from 80 nM gilteritinib (GILT)-treated MV4-11 cells. The blue arrows indicate the dots of Osteopontin at the same location in the film. The red arrows indicate the dots of MIF at the same location in the film. Note: Each antibody has two dot spots according to the manufacturer’s specification. (B) Cumulative Mean Pixel Densities of MIF (Fold Change); (C) Image of partial blot films developed for proteomic analyses of cell-free supernatants from 80 nM GILT-treated primary AML BMMNC cell (Patient #1). The black arrows indicate the reference spots (control dots) from the manufacturer. The red arrows indicate the dots of MIF at the same location in the film. (D) Cumulative Mean Pixel Densities of MIF (Fold Change from AML BMMNC, Patient #1); (E) 3 days after the treatment of 80 nM gilteritinib (GILT) or quizartinib (QUIZ) in vitro, the cells were collected for RNA isolation and gene expressions were analyzed by qPCR. Data show mRNA expressions of the genes encoding different receptors CD74, CD44 and CXCR2 for MIF; Representative FC histogram plot of CXCR2 expression in GILT-treated MV4-11 cells after 3 days in vitro; * p < 0.05, ** p < 0.01.

