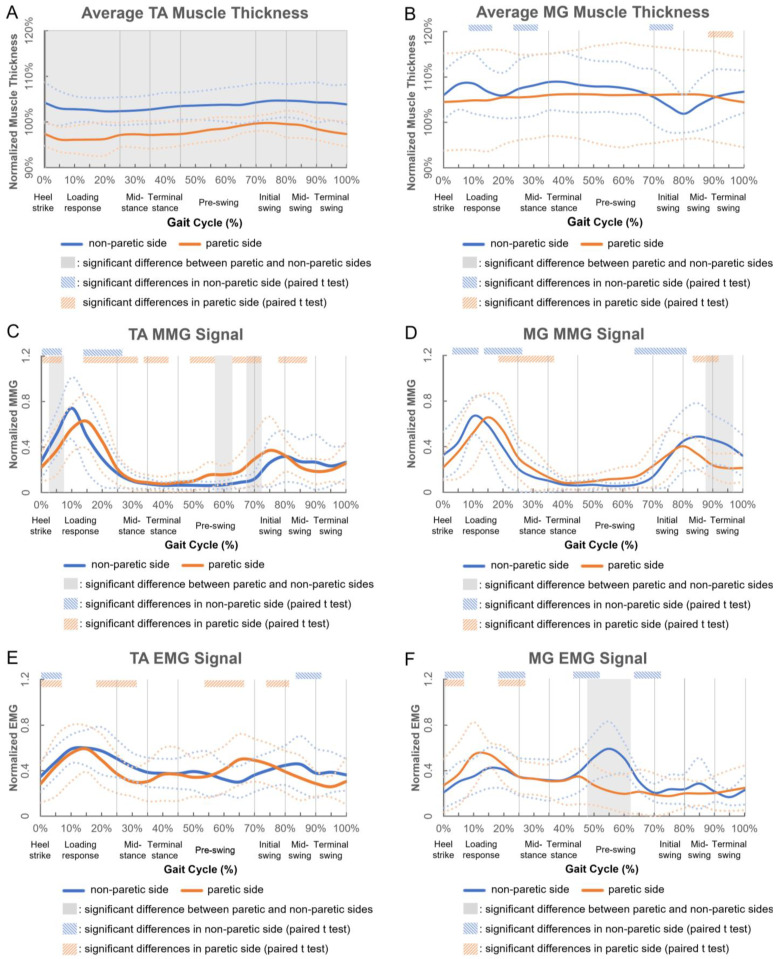
Figure 2.
Changes in (A) average TA muscle thickness, (B) average MG muscle thickness, (C) mechanomyography (MMG) signal of TA muscle, (D) MMG signal of MG muscle, (E) electromyography (EMG) signal of TA muscle and (F) electromyography (EMG) signal of MG muscle of nine participants in a gait cycle (solid and dashed blue/orange lines indicate the mean and the standard deviation of nine participants, respectively; solid vertical gray lines indicate the typical gait events/phases of stroke survivors [11]).

