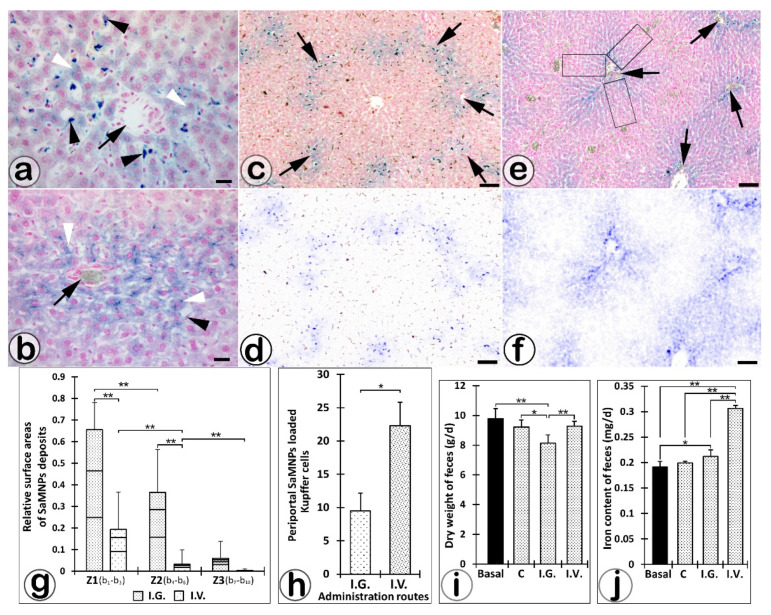
Figure 3.
Microscopy of the intracytoplasmic SaIONP deposits in hepatocytes (white arrowheads) and Kupffer cells (black arrowheads) located around the portal areas (black arrows) of the liver parenchyma harvested 24 h after IV (a) or IG (b) SaIONPs’ administration. The SaIONPs’ specific loading patterns of hepatic acini after IV (c,d) or IG (e,f) administration revealed by multispectral camera analysis (the boxes indicate the selected and analyzed areas around a portal space). Different zonal distribution of SaIONP deposits in periportal areas (g) and periportal Kupffer cells (h) relative to IV or IG routes of SaIONPs administration. Variation of dry weight (i) and total iron content of the feces after the IV or IG (j) SaIONPs’ administration (* p < 0.05; ** p < 0.01; (g–i) one-way ANOVA with post hoc Tukey test; (h) Student’s t-test). Perls Prussian blue (a,b,c,e) and anti-Iba-1 (c,d) stainings. Bar = 10 µm (a,b); 50 µm (c–f).

