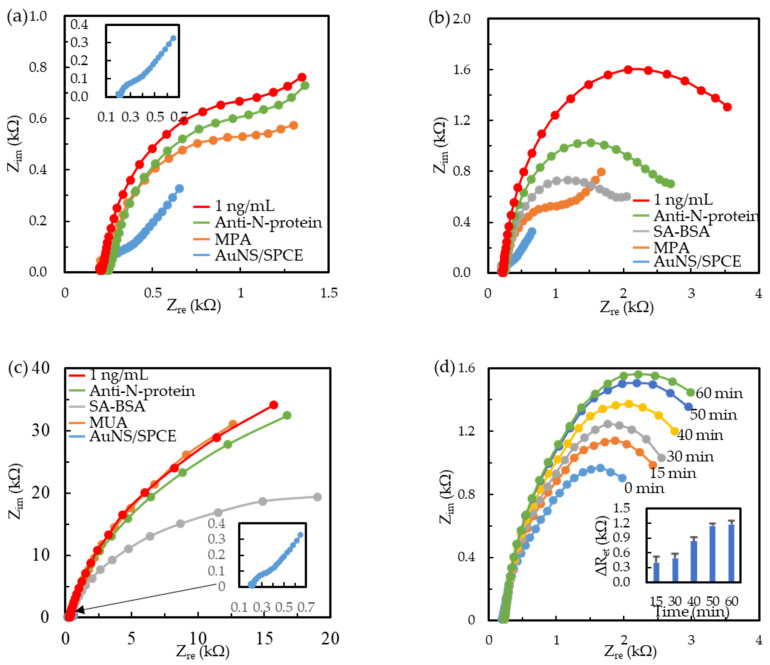
Figure 1.
Nyquist plots of immunosensor preparation and 1 ng/mL N-protein immunoreaction of Ab/MPA/SPCE (a), BioAb/SA-BSA/MPA/SPCE (b), and BioAb/SA-BSA/MUA/SPCE (c) measured in a 10 mM PBS solution containing 2.5 mM equimolar Fe(CN)63−/4−. The inset in (a,c) shows the Nyquist plot of bare AuNS/SPCEs. (d) Nyquist plots of time-dependent immunoreaction of 1 ng/mL N-protein on the BioAb/SA-BSA/MPA/SPCEs. Inset shows the time-dependent Ret increment (ΔRet = Ret-N-protein − Ret-Ab).

