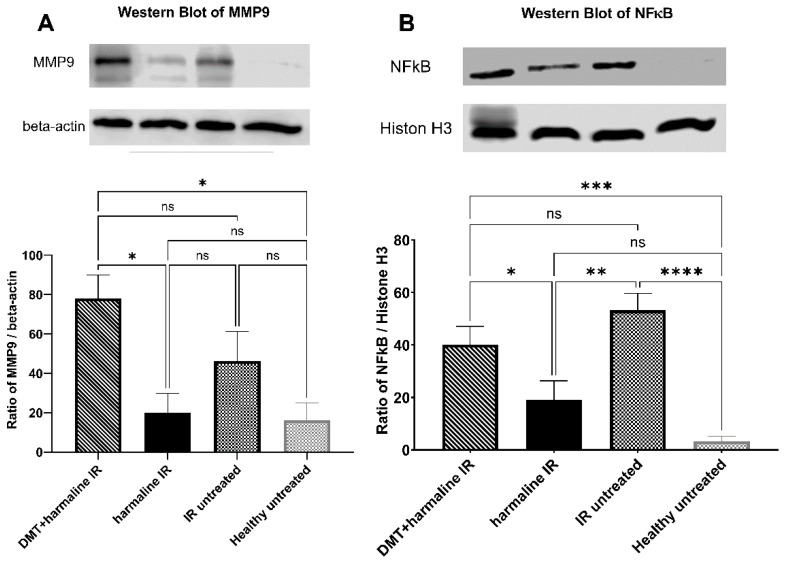
Figure 4.
Western blot results. (A): Expression levels of Matrix metallopeptidase 9 (MMP9) in the different groups. (B): Expression levels of nuclear factor kappa-light-chain-enhancer of activated B cells (NFκB) p65 subunit in the different groups. All results are plotted as mean percentages + SEM. ns = non-significant; * = p < 0.05; ** = p < 0.01; *** = p < 0.001; **** = p < 0.0001.

