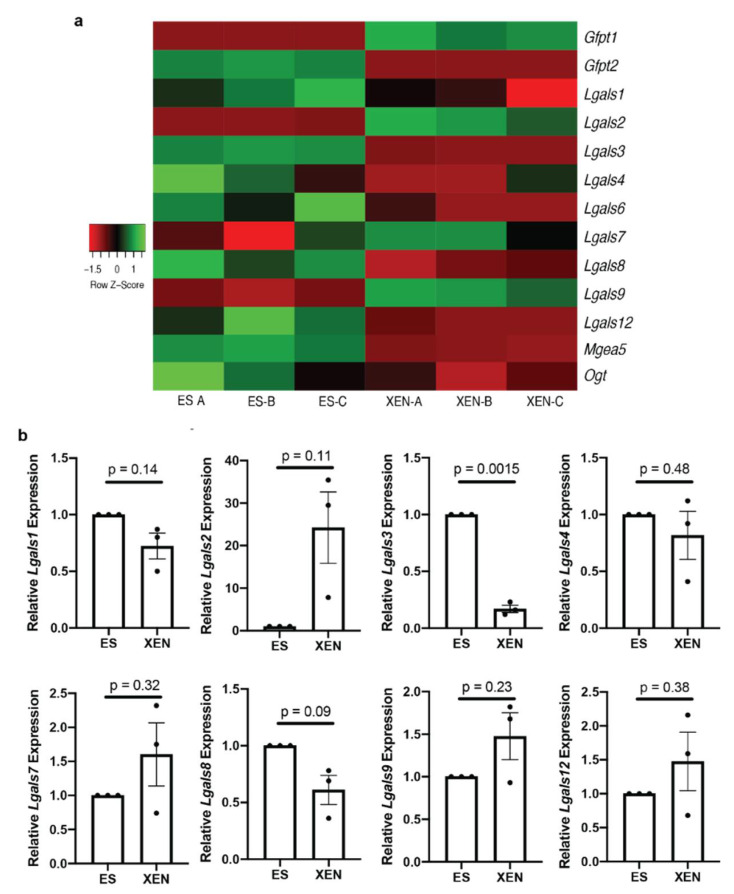
Figure 3.
RNA sequencing and gene expression analysis of galectin genes in ES cells and XEN: (a) heat map of RNA sequencing of transcripts in ES cells and XEN showing Lgals genes 1–4, 7–9, and 12 and genes involved in O-GlcNAcylation Ogt, Mgea5, Gfpt1, and Gfpt2; data are shown for 3 biological replicates denoted as -A, -B, and -C; (b) expression levels of Lgals1, Lgals2, Lgals3, Lgals4, Lgals7, Lgals8, Lgals9, and Lgals12 as detected by RT-qPCR. Bars represent mean ± SEM, N = 3.

