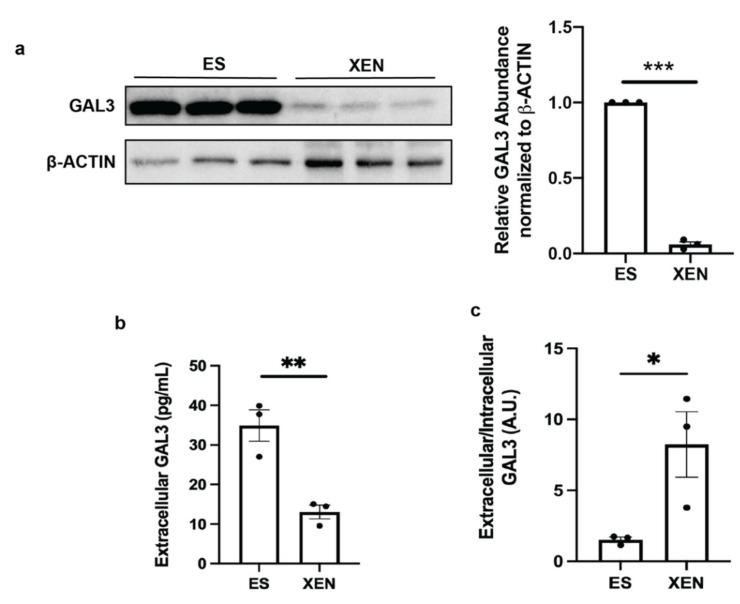
Figure 4.
ES cells increased intracellular galectin-3 levels while XEN cells increased extracellular galectin-3 levels compared to their own intracellular protein levels: (a) Western blot and densitometry of intracellular galectin-3 in ES and XEN cells; (b) ELISA of extracellular galectin-3 in the cell culture media of ES and XEN cells after 8 days normalized to total intracellular protein levels (mg/mL); (c) extracellular to intracellular ratio of galectin-3 in ES and XEN cell cultures both normalized to total intracellular protein levels (mg/mL) represented as arbitrary units (A.U.). Bars represent mean ± SEM, N = 3. * p < 0.05, ** p < 0.01, *** p < 0.001.

