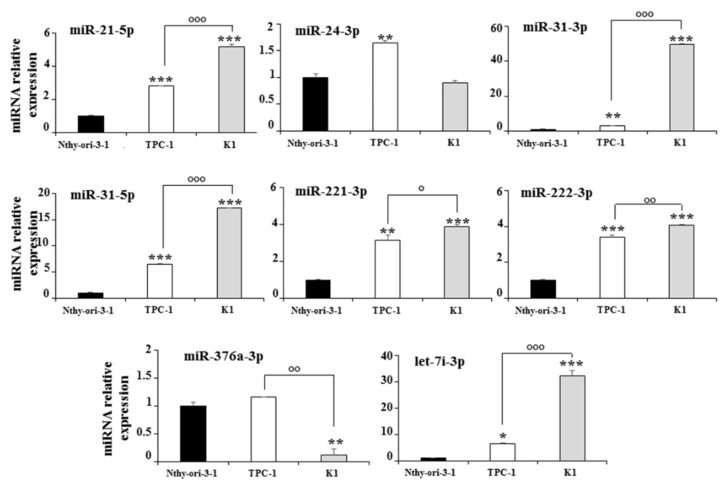
Figure 3.
Expression levels of cellular miRNAs in Nthy-ori-3-1, TPC-1, and K1 cells; miRNA expression levels are reported as the mean expression value of each PTC cell line and normalized to the mean expression of the Nthy-ori-3-1 cells (equal to 1). Error bars represent standard deviation; p-values were obtained by using one-way ANOVA with Tukey’s multiple comparison test: * p < 0.05, ** p < 0.01, *** p < 0.001 vs. Nthy-ori-3-1; ° p < 0.05, °° p < 0.01, °°° p < 0.001 vs. TPC-1.

