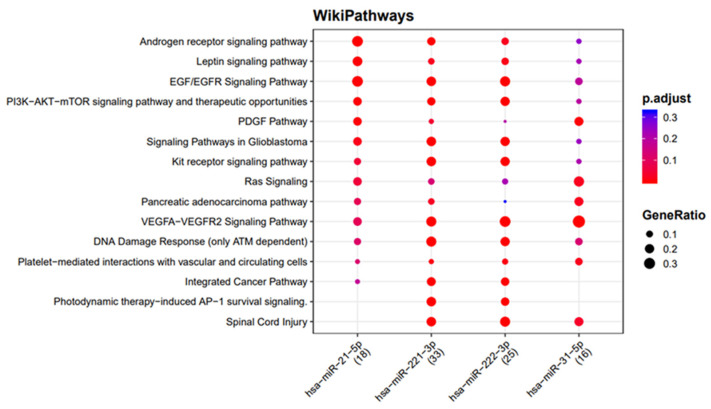
Figure 5.
Functional enrichment of miRNA target genes using the WikiPathways database. The colors of the circles represent the adjusted p-values (FDR), whereas their size represents the number of miRNA targets found to be annotated in each category over the total number of recognized targets (indicated in round brackets).

