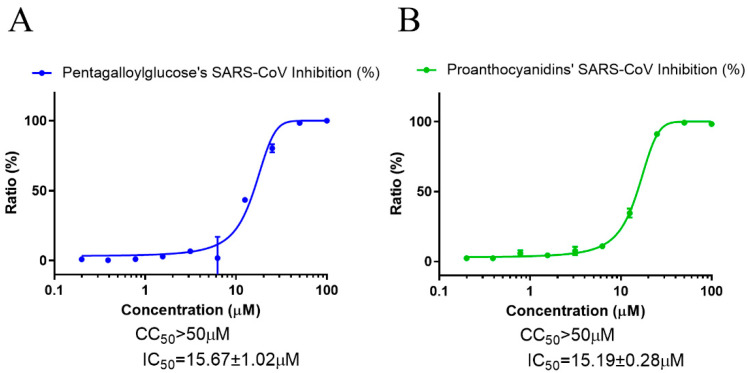
Figure 5.
Anti-SARS-CoV activity of PGG and PAC. (A) The dose–response curve analysis using the immunofluorescence-based antiviral assays presented the antiviral effect of PGG (A) and PAC (B) on the SARS-CoV infection in Vero cells. Blue circles (A) and green circles (B) indicate the inhibition percentage of the SARS-CoV infection by PGG and PAC, respectively, in a dose-dependent manner. The data represent duplicate experiments, and are presented as the mean ± SEM.

