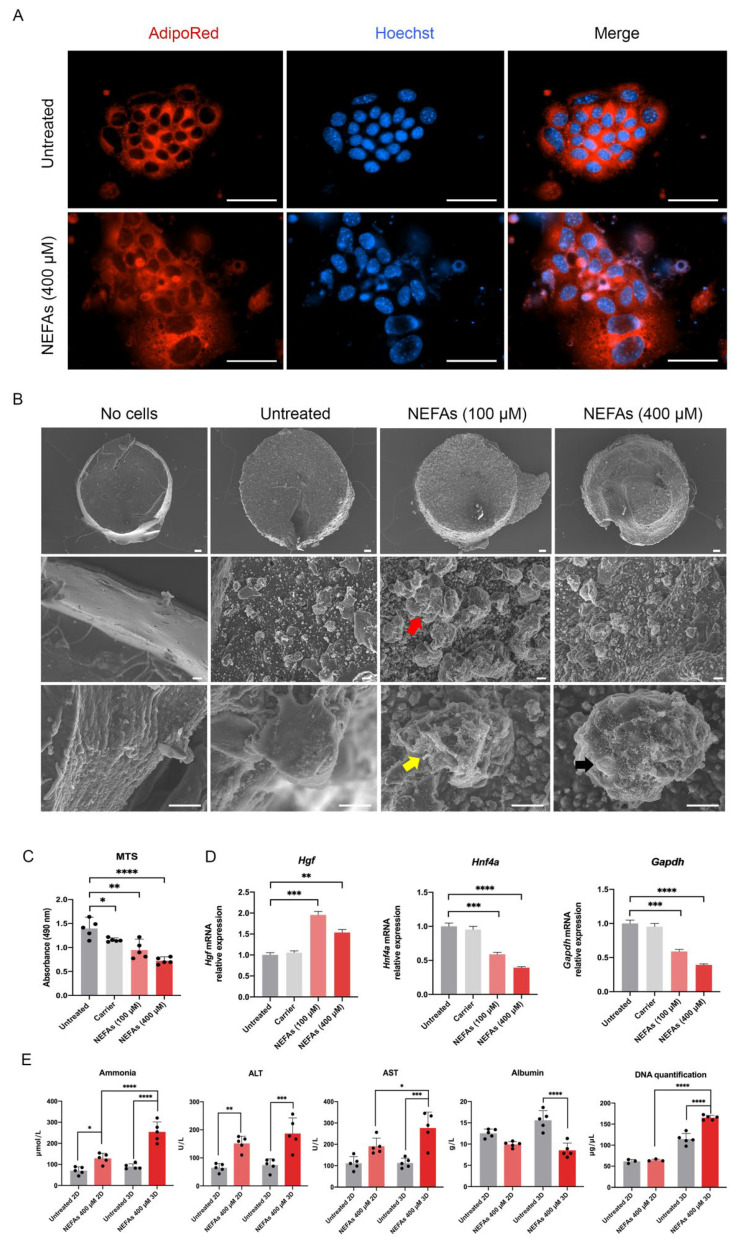
Figure 4.
In vitro three-dimensional model of Non-alcoholic fatty liver. (A) Confocal images of lipid accumulation in NEFAs treated hepatocytes assessed by AdipoRed™ assay. Scale bar = 200 µm. (B) Ultrastructural assessment of AML12 cells phenotype by scanning electron microscopy. Red, yellow, and black arrows indicate increase in cell size, cytoplasmatic membrane disruption and apoptotic bodies, respectively. Scale bar top panel = 100 µm, middle panel = 10 µm, and bottom panel = 10 µm. (C) Metabolic activity of AML12 cells challenged with various concentrations of NEFAs measured by MTS assay. (D) Real-time qPCR of hepatocyte markers. The untreated condition was used as calibrator. (E) Biochemical analyses of the supernatant of 2D-3D AML12 challenged with NEFAs for 72 h assessed by clinical standard procedures. The results are expressed as mean values ± SEM and compared using one-way analysis of variance followed by post hoc tests when appropriate. * p < 0.05; ** p < 0.01; *** p < 0.001; **** p < 0.0001. NEFAs: non-esterified fatty acids; MTS: 3-[4,5,dimethylthiazol-2-yl]-5-[3-carboxymethoxy-phenyl]-2-[4-sulfophenyl]-2H-tetrazolium; Hgf: hepatocyte growth factor; Hnf4a: hepatocyte nuclear factor 4 alpha; Gapdh: glyceraldehyde 3-phosphate dehydrogenase; ALT: Alanine Aminotransferase; AST: Aspartate Aminotransferase.

