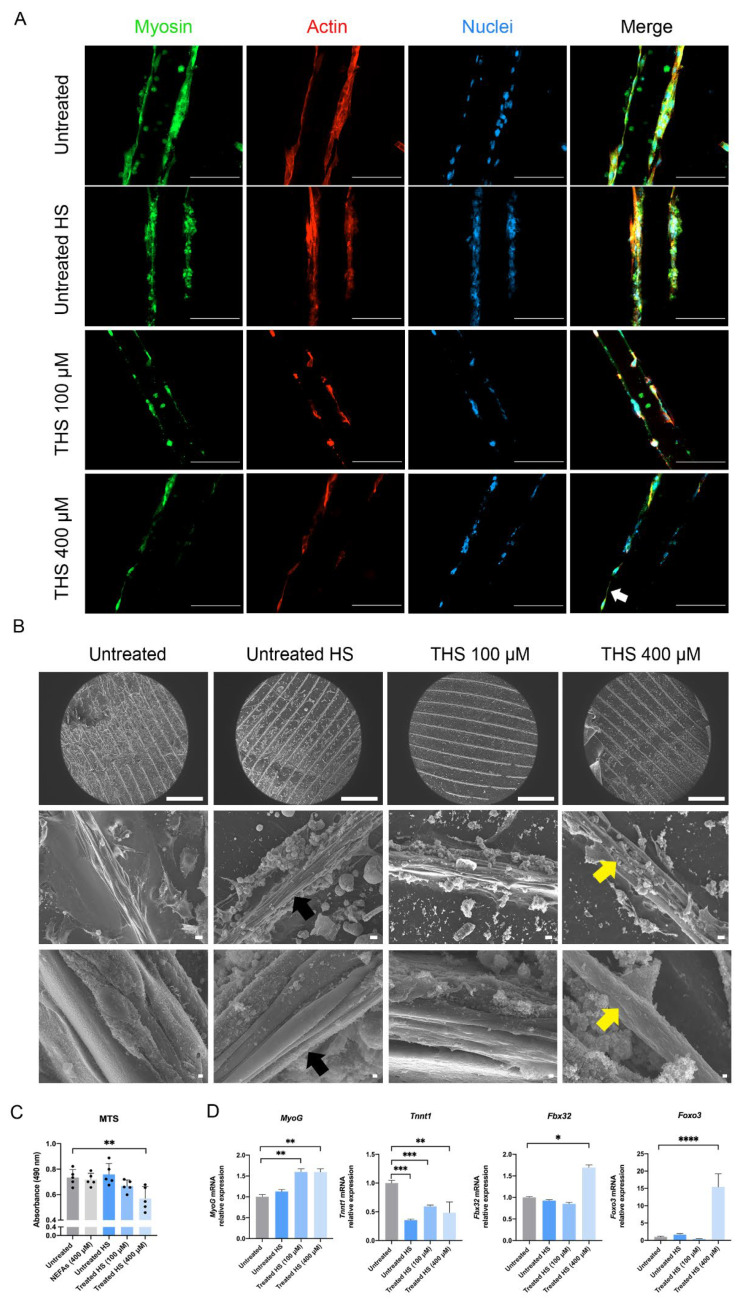
Figure 5.
Effect of fatty hepatocytes’ supernatant on 3D skeletal muscle tissues. (A) Confocal microscopy of myotubes differentiation markers. White arrow indicates the loss of cytoplasm. Scale bar = 100 µm. Nuclei stained using DAPI. (B) Scanning electron microscopy of 3D skeletal muscle tissues incubated with supernatant from fatty hepatocytes. Black and yellow arrows indicate differentiated myotubes and loss of cytoplasm, respectively. Scale bar top panel = 1 mm, middle panel = 10 µm, and bottom panel = 1 µm. (C) Metabolic activity of C2C12 myotubes incubated with supernatant from fatty AML12. (D) Real-time qPCR of myotubes maturation (MyoG and Tnnt1) and atrophy (Fbx32 and Foxo3) markers. The untreated condition was used as calibrator. The Results are expressed as mean values ± SEM and compared using one-way analysis of variance followed by post hoc tests when appropriate. * p < 0.05; ** p < 0.01; *** p < 0.001; **** p < 0.0001. THS: treated hepatocytes’ supernatant; HS: hepatocytes’ supernatant; MTS: 3-[4,5,dimethylthiazol-2-yl]-5-[3-carboxymethoxy-phenyl]-2-[4-sulfophenyl]-2H-tetrazolium; MyoG: Myogenin; Tnnt1: Troponin T1; Fbx32: F-Box Protein 32; Foxo3: Forkhead Box O3.

