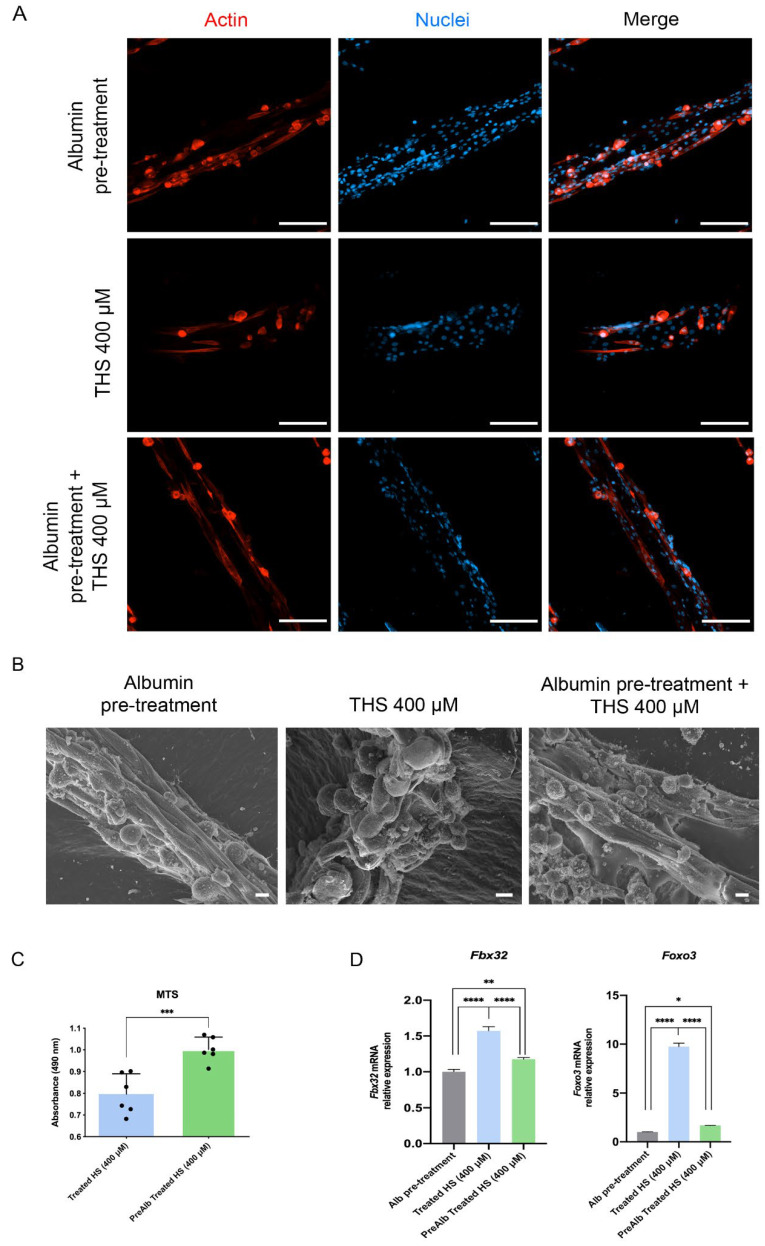
Figure 7.
Effect of albumin pre-treated hepatocytes’ supernatant on 3D skeletal muscle tissues. (A) Confocal microscopy images of myotubes cytoskeleton. Scale bar = 200 µm. Nuclei stained using DAPI. (B) Scanning electron microscopy of 3D skeletal muscle tissues incubated with supernatant from pre-treated hepatocytes. Scale bar = 10 µm. (C) Metabolic activity of 3D skeletal muscle tissues incubated with supernatant from pre-treated hepatocytes. (D) Real-time qPCR of myotubes atrophy markers. The untreated condition was used as calibrator. The results are expressed as mean values ± SEM and compared using one-way analysis of variance followed by post hoc tests when appropriate. * p < 0.05; ** p < 0.01; *** p < 0.001; **** p < 0.0001. THS: treated hepatocytes’ supernatant; MTS: 3-[4,5,dimethylthiazol-2-yl]-5-[3-carboxymethoxy-phenyl]-2-[4-sulfophenyl]-2H-tetrazolium; Fbx32: F-Box Protein 32; Foxo3: Forkhead Box O3.

