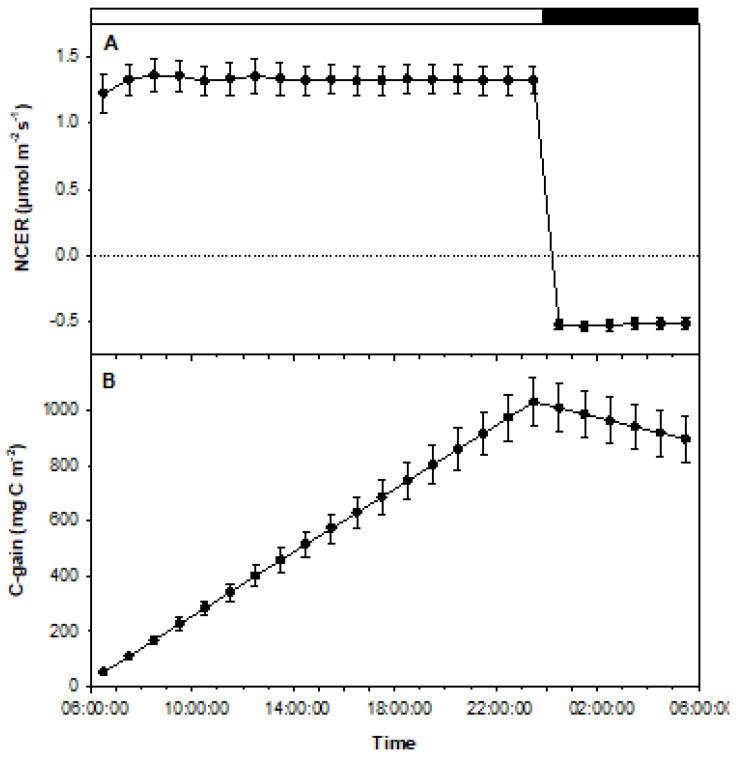
Figure 6.
Graphical representations of the data collected from experiment 2. Data represent average NCERs of 4 fully rooted plantlets (n = 4). (A) Positive values indicate photosynthetic rates during the period of illumination, while negative values represent respiration during the period of darkness. Error bars signify mean standard errors. (B) Tracking carbon gains and losses throughout the experiment based on NCER values during light and dark periods. C-gains increased during light periods and decreased in darkness. Error bars represent mean standard errors.

