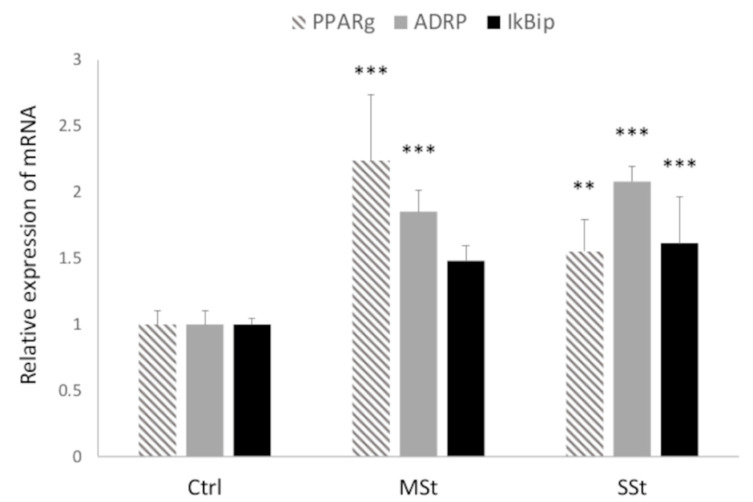
Figure 3.
Modulation of cell function in moderate and severe steatosis models. The mRNA expression of PPARγ, ADRP and of IkBip were evaluated by qPCR using GAPDH as the internal control. Data are expressed as fold induction with respect to controls. Bars represent SD. ANOVA followed by Tukey’s test was used to assess the statistical significance between groups. Symbols: Ctrl vs. all treatments ** p ≤ 0.01, *** p ≤ 0.001.

