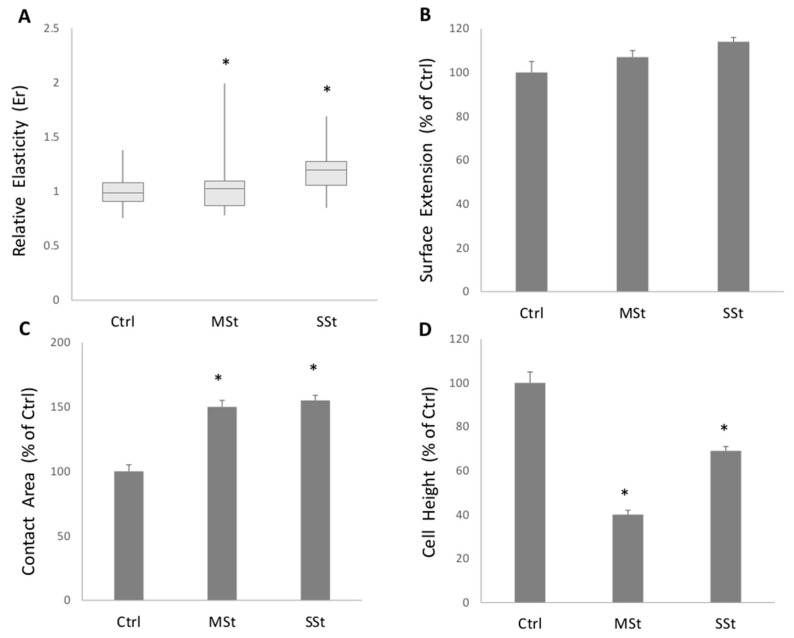
Figure 4.
Changes in single cell biomechanical properties in moderate and severe steatosis models. (A) Relative Elasticity (Er) of single cell respect to the control, obtained through the FIEL method. Symbols: Ctrl vs. all treatments * p ≤ 0.05. The morphometric indicators computed for all the treatments are presented relative to the controls: (B) surface extension (SE); (C) cell contact area (AC); (D) height of the cells (HC). Statistical significance respect to the control is marked when at least * p ≤ 0.05.

