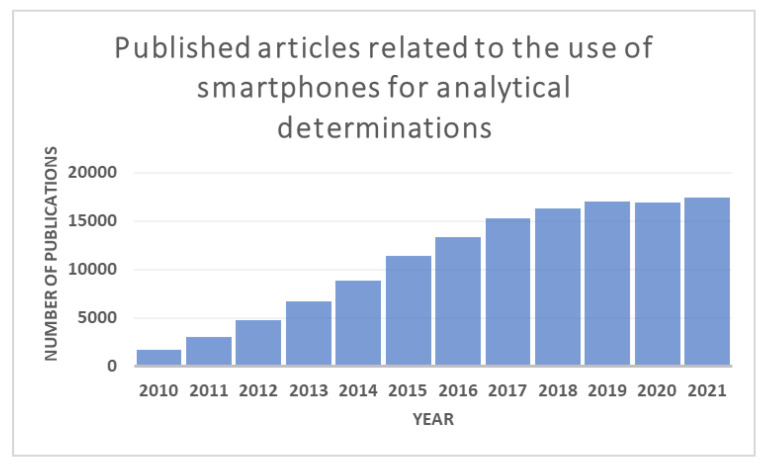
Figure 1.
The self-developed graph shows the number of publications related to the use of smartphones for analytical purposes by year. The data was compiled by searching the keywords “Smartphone analytical determinations” in the Google Scholar Research Gate. The graph shows a significant increase in the published articles in the last twelve years.

