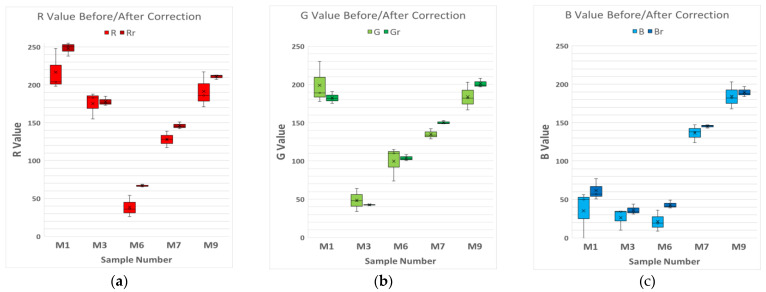
Figure 5.
Box and Whisker plot of 5 RAL samples chosen randomly, associated with their RGB values. The lighter colors are the RGB values before the correction and the darker ones are after the correction. (a) Red channel values of five samples before/after the correction. (b) Green channel values of five samples before/after the correction. (c) Blue channel values of five samples before/after the correction.

