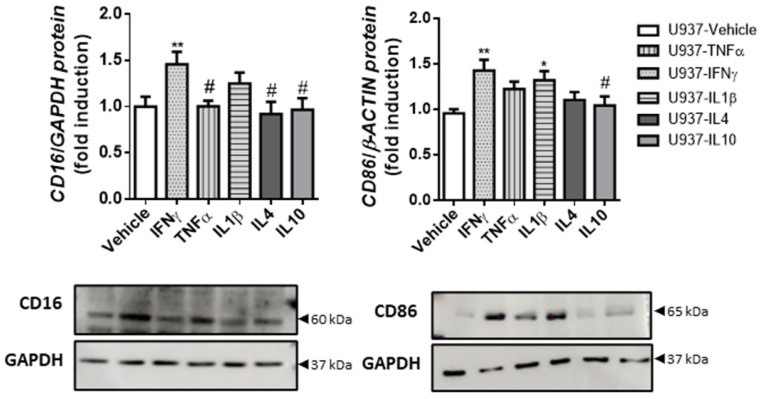
Figure 5.
IFNγ-treated macrophages exhibit increased CD86 and CD16 expression. U937 cells were treated with IFNγ, TNFα, IL1β, IL4 or IL10, or vehicle for 4 days. Graphs show the protein expression of CD16 (n = 11) and CD86 (n = 20). The images correspond to a representative Western blot. In all cases, the bars in the graphs represent mean ± SEM, and significant differences vs. U937-vehicle cells are shown by * p < 0.05 and ** p < 0.01, and vs. U937-IFNγ by # p < 0.05.

