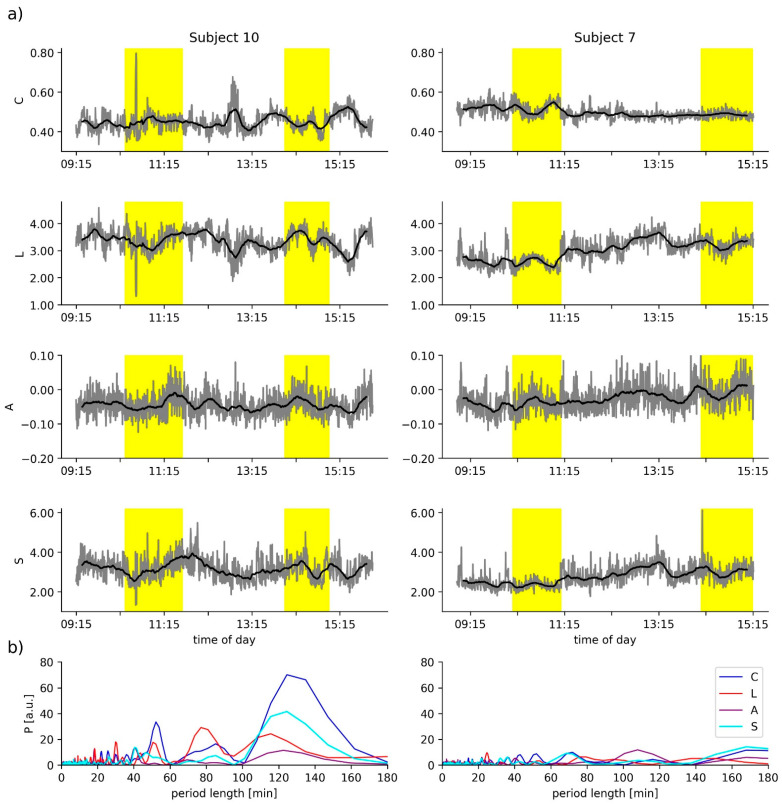
Figure 2.
(a) Exemplary time courses (grey lines) of average clustering coefficient C, average shortest path length L, assortativity A, and synchronisability S of two subjects. Smoothed time courses (moving average over 17 min) are shown as black lines. Yellow-shaded areas mark the two 1 h stimulation phases. (b) Power spectral density estimates P of the respective time courses.

