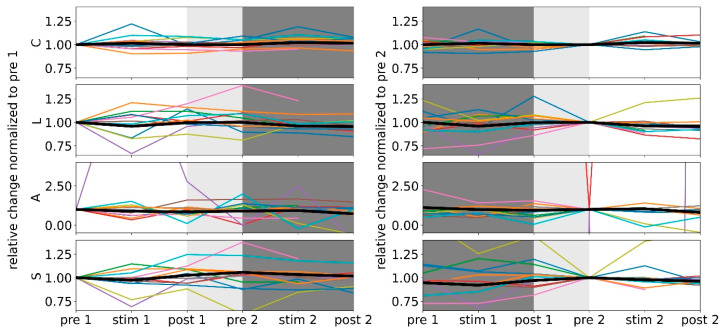
Figure 3.
Relative changes of global network characteristics (average clustering coefficient C, average shortest path length L, assortativity A, and synchronisability S) of all responders (colour-coded). Group medians are shown in black, and all lines are for eye-guidance only. Data normalized to the respective values from the morning pre-stimulation phase (left; white-shaded area) and from the afternoon pre-stimulation phase (right; white-shaded area). Light-grey shaded area marks the break between the two 3 h examination phases. The different scaling of the y-axis for assortativity is due to the fact that this characteristic only rarely deviated from −0.02 which resulted in anomalous large relative deviations. We note that we obtained for the vast majority of investigated networks, indications for a random topology (their assortativity values were confined to the range of A values derived from 1000 random networks with the same number of vertices and edge densities as the evolving functional brain networks).

