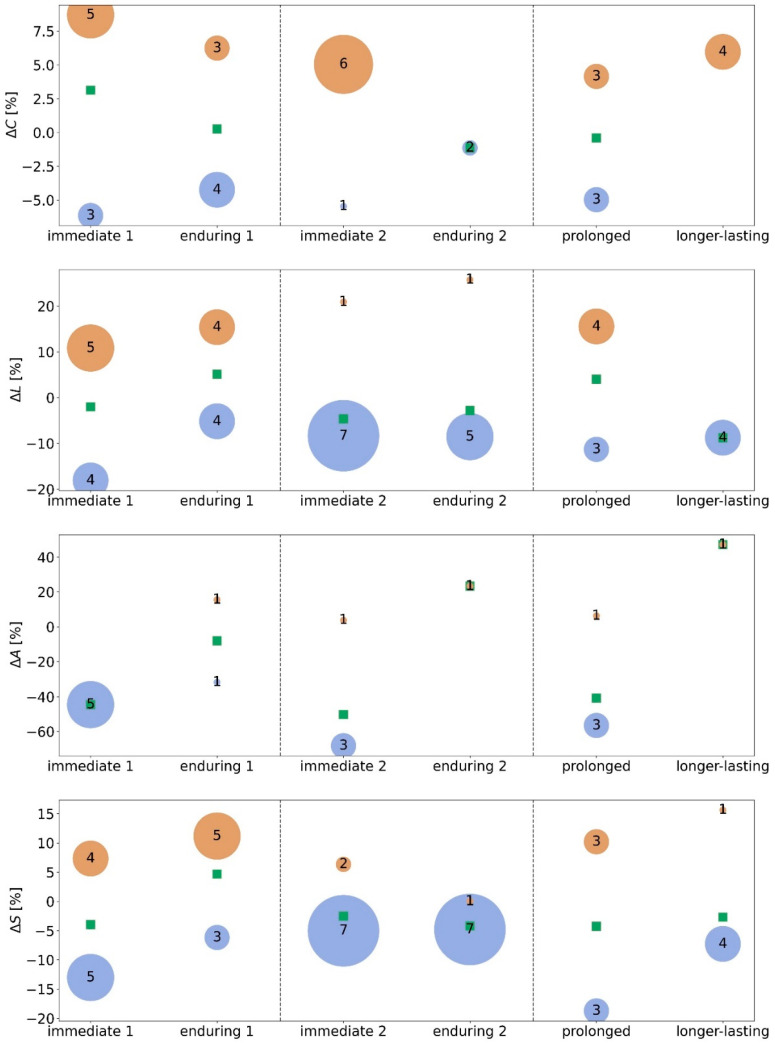
Figure 4.
Bubble chart of taVNS-induced immediate, enduring, prolonged, and longer-lasting relative changes Δ of global network characteristics of all responders (average clustering coefficient C, average shortest path length L, assortativity A, and synchronisability S; Δ = (Ml − Mk)/Mk, where Mk and Ml denote placeholders for the temporal average of the respective characteristics from phase k and phase l; cf. Figure 1). Responders are assigned to subgroups according to their direction of change (positive/negative changes are shown in orange/blue). A disk is centred at a subgroup’s mean relative change, and the diameter of a disk encodes the number of subjects per subgroup. Mean relative changes from both groups are shown as green squares.

