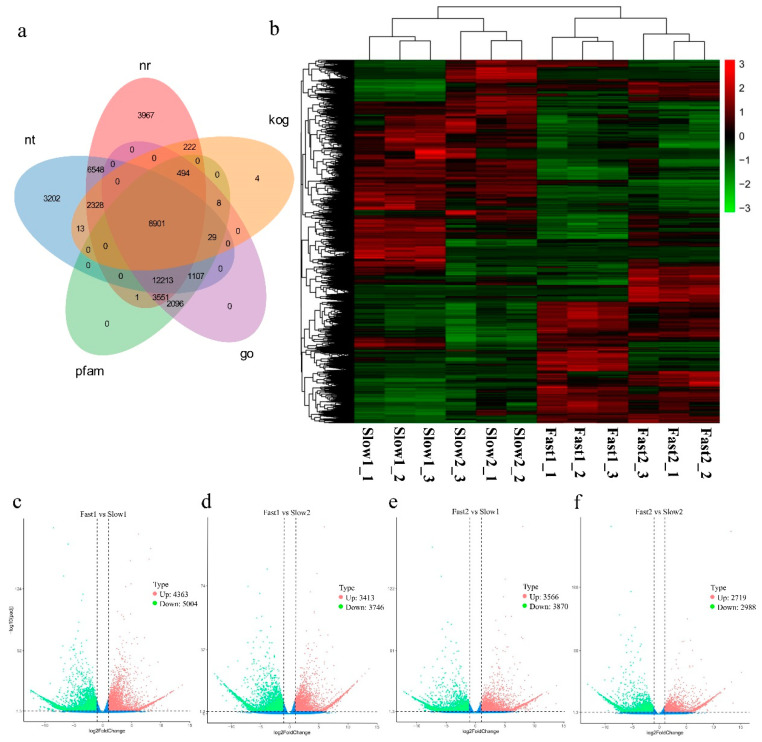
Figure 2.
(a) Venn diagram of functional annotations of unigenes in nt (NCBI non-redundant protein sequences), nr (NCBI non-redundant protein sequences), kog (Clusters of Orthologous Groups of proteins), go (Gene Ontology) and pfam (Protein family) databases. (b) Heatmap of expression patterns in fast- (Fast1: UGu17 and Fast2: UZuantian) and slow-growing cultivars (Slow1: U81-07 and Slow2: U82-39) samples. (c–f) Expression patterns of differentially expressed genes (DEGs) identified between fast- and slow-growing cultivars. Red and green dots represent DEGs, blue dots indicate genes that were not differentially expressed. Totals of 9367 (Up = 4363, Down = 5004), 7159 (Up = 3413, Down = 3746), 7436 (Up = 3566, Down = 3870), 5707 (Up = 2719, Down = 2988) unigenes were filtered as dysregulated genes in comparisons between Fast1 vs. Slow1 (F1vS1), Fast1 vs. Slow2 (F1vS2), Fast2 vs. Slow1 (F2vS1), Fast2 vs. Slow2 (F2vS2) with the cutoff of padj < 0.05 and |log2(foldchange)| > 1.

