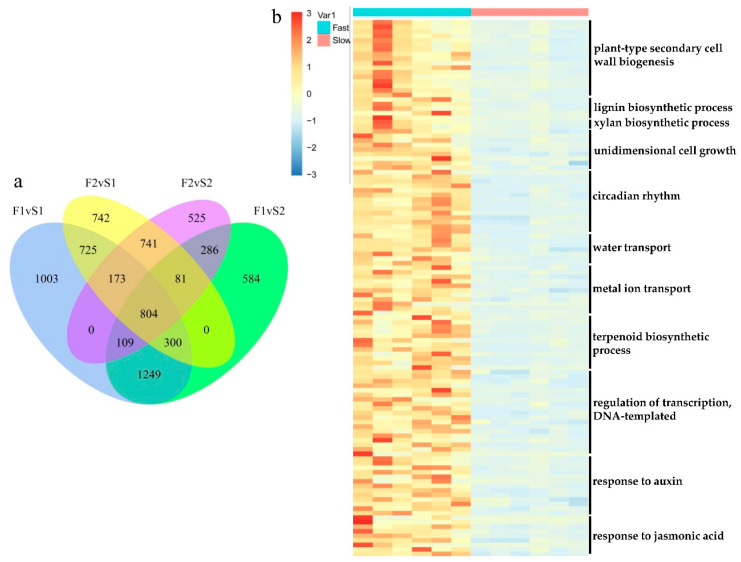
Figure 3.
(a) The Venn analysis result of upregulated genes for fast-growing samples compared with slow-growing samples. There were 804 common up-regulated genes for fast samples compared with slow samples. Samples of Fast1 vs. Slow1 and Fast2 vs. Slow1 (F2vS1) had a relatively large number of characteristic up-regulated genes. (b) Expression patterns of 118 differentially expressed genes (DEGs) enriched in the key gene ontology (GO) biological processes (BPs).

