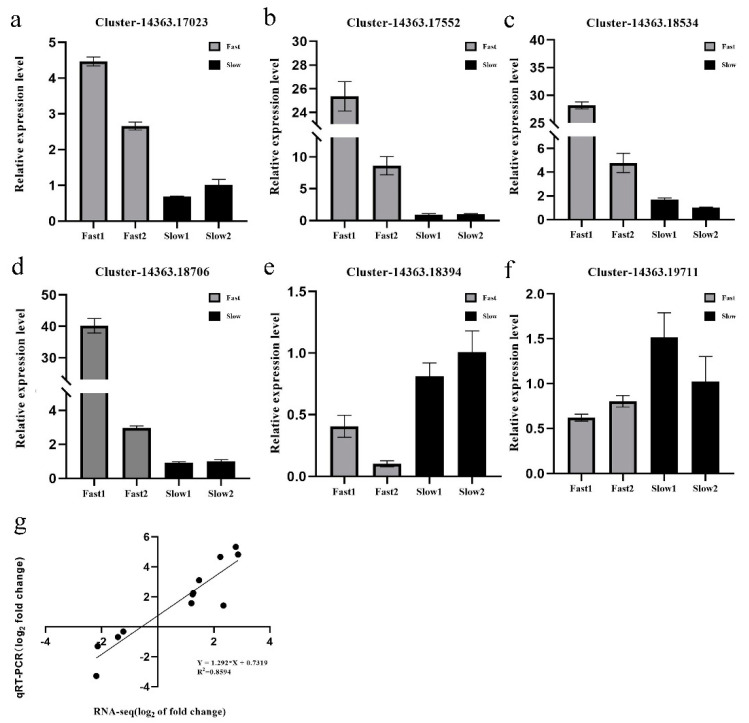
Figure 5.
Validation of RNA-Seq data. Verification of the expression level of the selected eight DEGs from RNA−Seq data through RT-qPCR: (a) Cluster_14363.17023, (b) Cluster_14363.17552, (c) Cluster_14363.18534, (d) Cluster_14363.18706, (e) Cluster_14363.18394, (f) Cluster_14363.19711. Error bars indicate the standard error as mean + SD. The x axis represents the relative expression level, and the y-axis represents cultivars. (g) Correlation coefficient of gene expression between qRT−PCR analysis and RNA-Seq data.

