Figure 6.
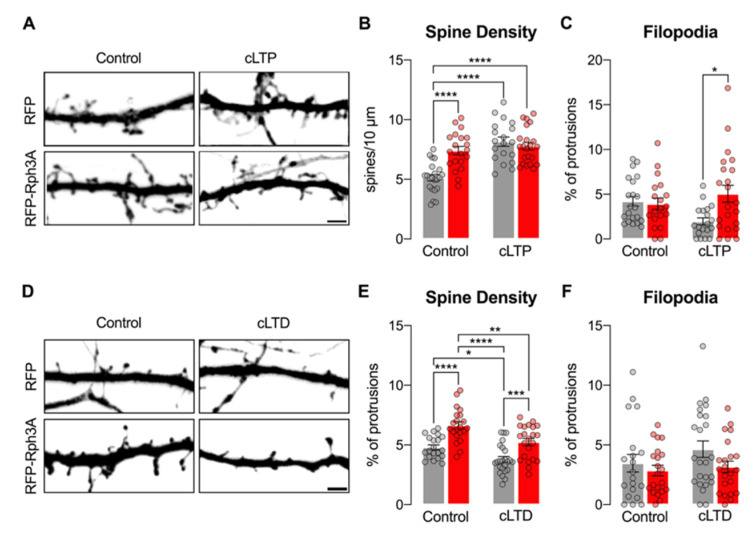
Rph3A affects cLTP but not cLTD. (A): Confocal images of GFP filler in the dendritic spines of RFP (up) or RFP-Rph3A (down) transfected neurons under control conditions (left) or after cLTP (right). Scale bar: 2 µm. (B,C): Bar graph representation of mean ± SEM spine density (B) and mean ± SEM filopodia proportions (C) in RFP (grey) or RFP-Rph3A (red) transfected neurons under control conditions or after cLTP. One-way ANOVA with Tukey post-hoc test. (D): Confocal images of GFP filler in the dendritic spines of RFP (up) or RFP-Rph3A (down) transfected neurons under control conditions (left) or after cLTD (right). Scale bar: 2 µm. (E,F): Bar graph representation of mean ± SEM spine density (E) and mean ± SEM filopodia proportions (F) in RFP (grey) or RFP-Rph3A (red) transfected neurons under control conditions or after cLTD. One-way ANOVA with Tukey post-hoc test. * p < 0.05; ** p < 0.01; *** p < 0.001; **** p < 0.0001. Dots represent single values.

